| tags: [ Gaston GWAS R ] categories: [Coding Experiments ]
GWAS rerun MAF 0.05
require(magicfor)## Loading required package: magicfor## Warning in library(package, lib.loc = lib.loc, character.only = TRUE,
## logical.return = TRUE, : there is no package called 'magicfor'require(magrittr)## Loading required package: magrittrrequire(dplyr)## Loading required package: dplyr##
## Attaching package: 'dplyr'## The following objects are masked from 'package:stats':
##
## filter, lag## The following objects are masked from 'package:base':
##
## intersect, setdiff, setequal, unionrequire(gaston)## Loading required package: gaston## Loading required package: Rcpp## Loading required package: RcppParallel##
## Attaching package: 'RcppParallel'## The following object is masked from 'package:Rcpp':
##
## LdFlags## Gaston set number of threads to 2. Use setThreadOptions() to modify this.##
## Attaching package: 'gaston'## The following object is masked from 'package:stats':
##
## sigma## The following objects are masked from 'package:base':
##
## cbind, rbindrequire(qqman)## Loading required package: qqman## ## For example usage please run: vignette('qqman')## ## Citation appreciated but not required:## Turner, S.D. qqman: an R package for visualizing GWAS results using Q-Q and manhattan plots. biorXiv DOI: 10.1101/005165 (2014).## ##
## Attaching package: 'qqman'## The following object is masked from 'package:gaston':
##
## manhattan##load heritable pheno data
her_pheno24918 <- read.csv('C:/Users/Martha/Documents/Honours/Project/honours.project/Data/nies_heritable_pheno240918.csv')
head(her_pheno24918)## UUID R.K.value.V L.Pachimetry R.Cyl..pre.dilate. R.Pachimetry
## 1 219960 43.00 554 0.00 532
## 2 313180 42.25 612 -0.75 608
## 3 320511 43.50 512 0.00 499
## 4 400011 43.25 601 -0.25 602
## 5 400013 43.00 550 -0.25 552
## 6 316131 44.00 588 -1.00 583
## totaluvafmm L.K.value.V R.CDR R.K.value.H L.CDR L.Axial.Length
## 1 0.0 43.50 0.9 42.00 0.9 24.10
## 2 74.4 42.00 0.9 41.25 0.7 25.21
## 3 27.5 42.50 0.4 42.50 0.4 23.65
## 4 47.0 43.25 0.6 42.50 0.6 23.34
## 5 20.1 43.00 0.4 43.00 0.4 22.70
## 6 12.9 43.50 0.3 42.75 0.3 23.54
## R.Axial.Length L.AC.Depth R.AC.Depth L.K.value.H R.IOP.mmHg L.IOP.mmHg
## 1 24.31 3.03 3.09 42.50 14 14
## 2 25.02 3.92 3.38 41.50 16 15
## 3 23.37 3.08 3.29 42.00 17 18
## 4 23.32 3.83 3.81 42.75 15 17
## 5 22.93 3.13 3.22 42.75 18 18
## 6 23.49 3.04 3.24 43.00 12 12
## coord.Dim.1 coord.Dim.4 coord.Dim.3 coord.Dim.8 coord.Dim.7 coord.Dim.2
## 1 -1.3318012 0.8399155 0.75849347 -1.0126837 2.8552892 -1.1948332
## 2 -3.7993478 2.0776045 0.41111735 0.3400838 2.2543673 -0.2657678
## 3 -0.4961408 -0.9796890 -0.62633667 0.1104747 -1.1828388 -0.9254222
## 4 -0.7904275 1.5424175 -1.18429936 1.5903830 2.2077992 0.3391719
## 5 0.4462229 0.4965415 -0.03864912 -0.2245313 -0.5839491 -1.7106022
## 6 0.2319576 -0.4216580 0.16696557 -0.8347539 1.1946733 -0.9769405nies_covar <- read.csv('C:/Users/Martha/Documents/Honours/Project/honours.project/Data/nies_covar.csv')
head(nies_covar)## UUID Sex Age
## 1 219960 1 53
## 2 313180 1 55
## 3 320511 2 60
## 4 400011 1 23
## 5 400013 1 50
## 6 316131 2 77##load genomic data
merged_nies_071118 <- read.bed.matrix("C:/Users/Martha/Documents/Honours/Project/honours.project/Data/merged_nies/merged_nies_geno071118.bed")## Reading C:/Users/Martha/Documents/Honours/Project/honours.project/Data/merged_nies/merged_nies_geno071118.fam
## Reading C:/Users/Martha/Documents/Honours/Project/honours.project/Data/merged_nies/merged_nies_geno071118.bim
## Reading C:/Users/Martha/Documents/Honours/Project/honours.project/Data/merged_nies/merged_nies_geno071118.bed
## ped stats and snps stats have been set.
## 'p' has been set.
## 'mu' and 'sigma' have been set.##set GRM etc.
merged_nies_GRM <- GRM(merged_nies_071118)
merged_nies_eiK <- eigen(merged_nies_GRM)
merged_nies_eiK$values[ merged_nies_eiK$values < 0] <- 0
merged_nies_PC <- sweep(merged_nies_eiK$vectors, 2, sqrt(merged_nies_eiK$values), "*") #PCs = 2#run GWAS with covariates
for (i in c(2:ncol(her_pheno24918))){
pheno_colnames <- colnames(her_pheno24918[i])
her_pheno_gwas <- association.test(merged_nies_071118, her_pheno24918[,i], X = nies_covar, method = "lmm", test = "lrt", K = merged_nies_GRM, eigenK = merged_nies_eiK, p =2)
her_pheno_gwas <- na.omit(her_pheno_gwas)
pheno_gwas_filtered <- her_pheno_gwas %>% filter(-log10(p)>1) %>% filter(freqA2 < 0.99)
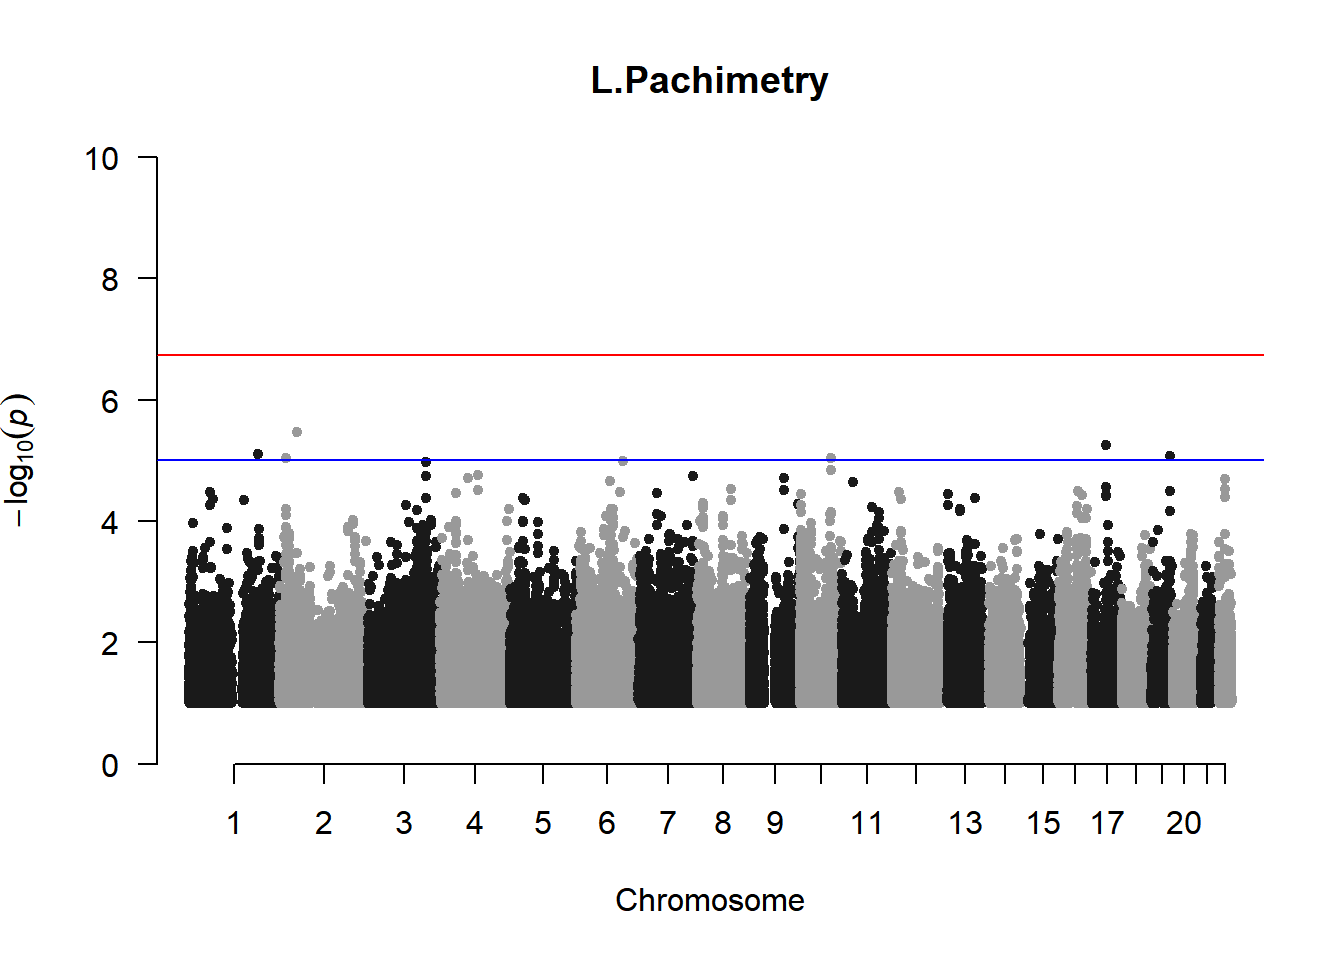
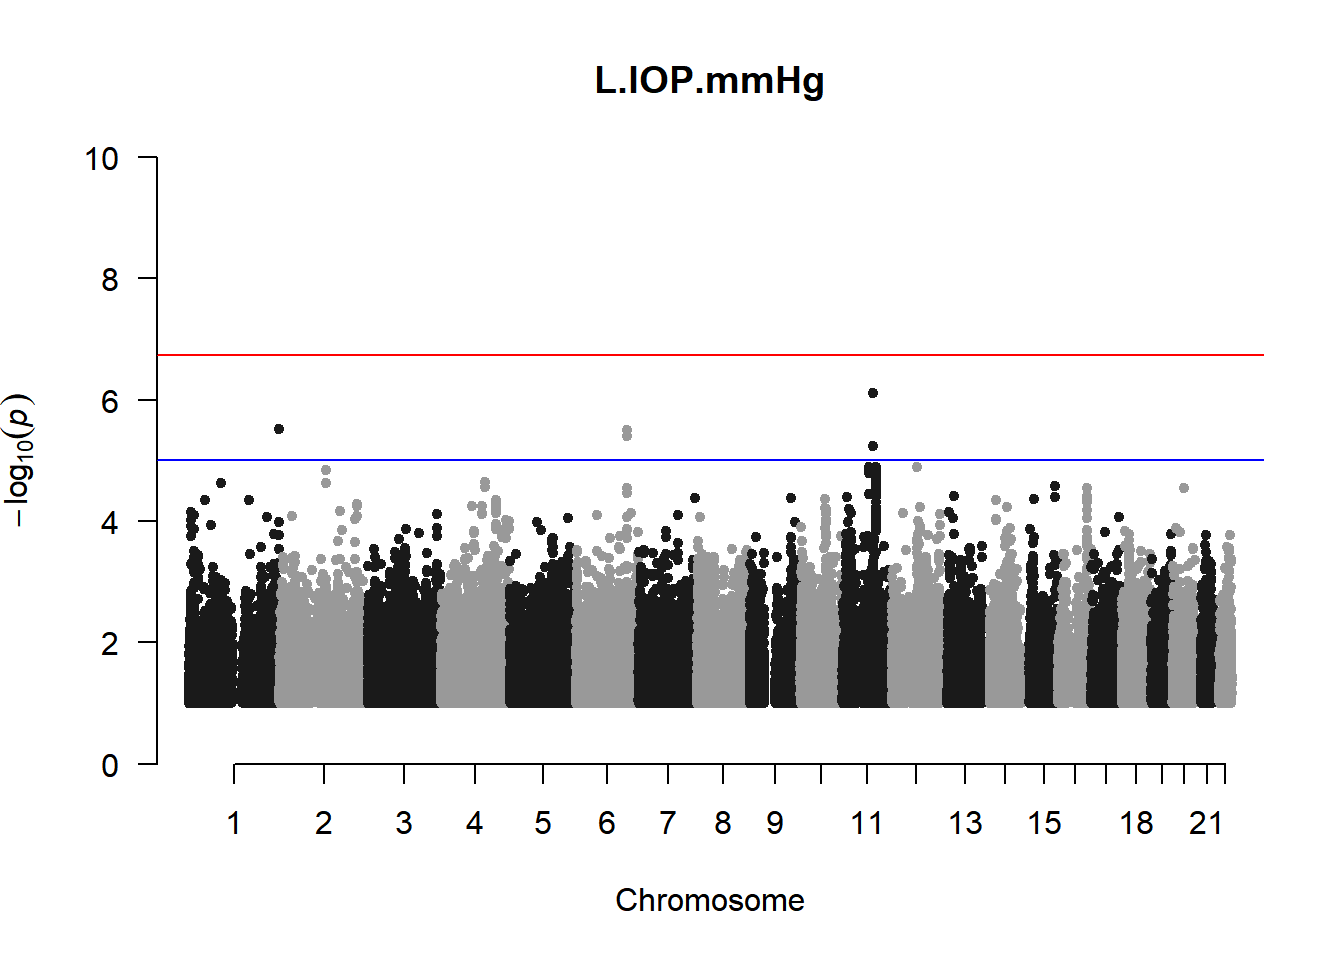
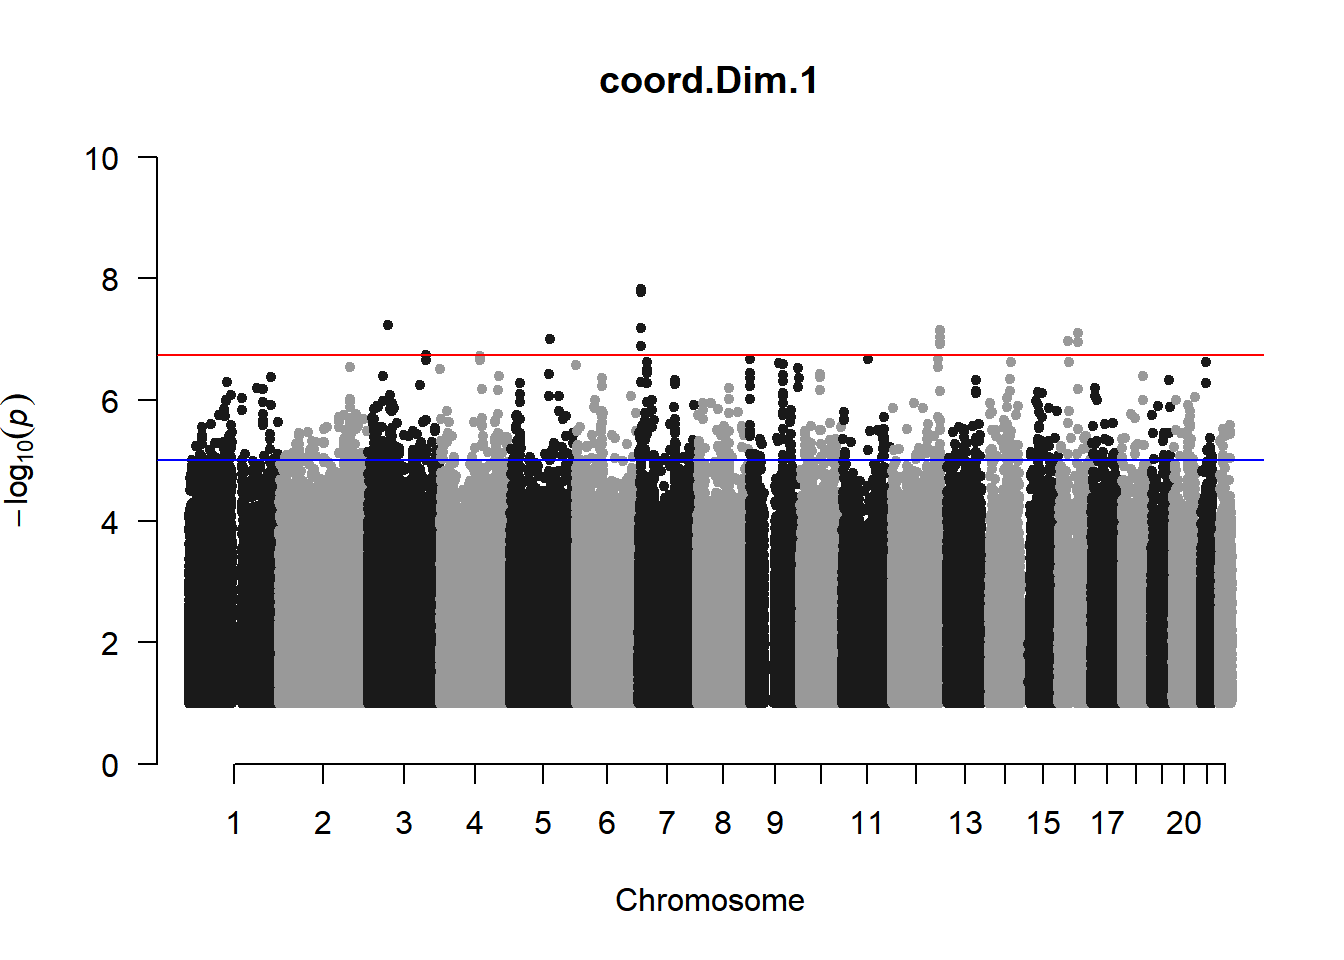
qqman::manhattan(x = pheno_gwas_filtered, chr = "chr", bp = "pos", p = "p", snp = "id", genomewideline = -log10(1.84e-7), main = paste(pheno_colnames), ylim = c(0,10))
}## Warning in trans.X(X, eigenK$vectors[, seq_len(p)], mean(Y)): An intercept
## column was added to the covariate matrix X
## Warning in trans.X(X, eigenK$vectors[, seq_len(p)], mean(Y)): An intercept
## column was added to the covariate matrix X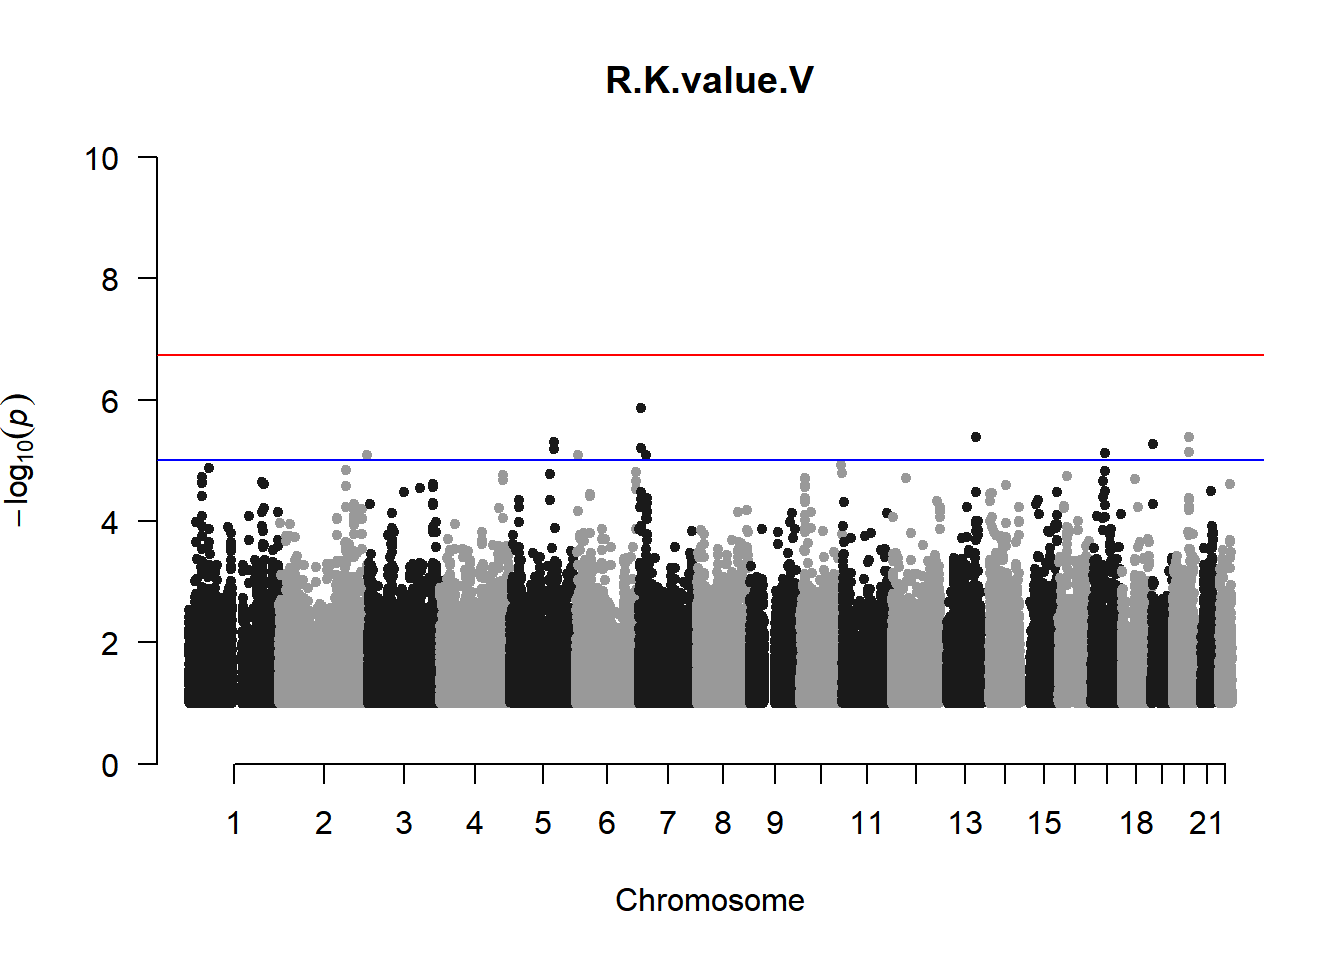
## Warning in trans.X(X, eigenK$vectors[, seq_len(p)], mean(Y)): An intercept
## column was added to the covariate matrix X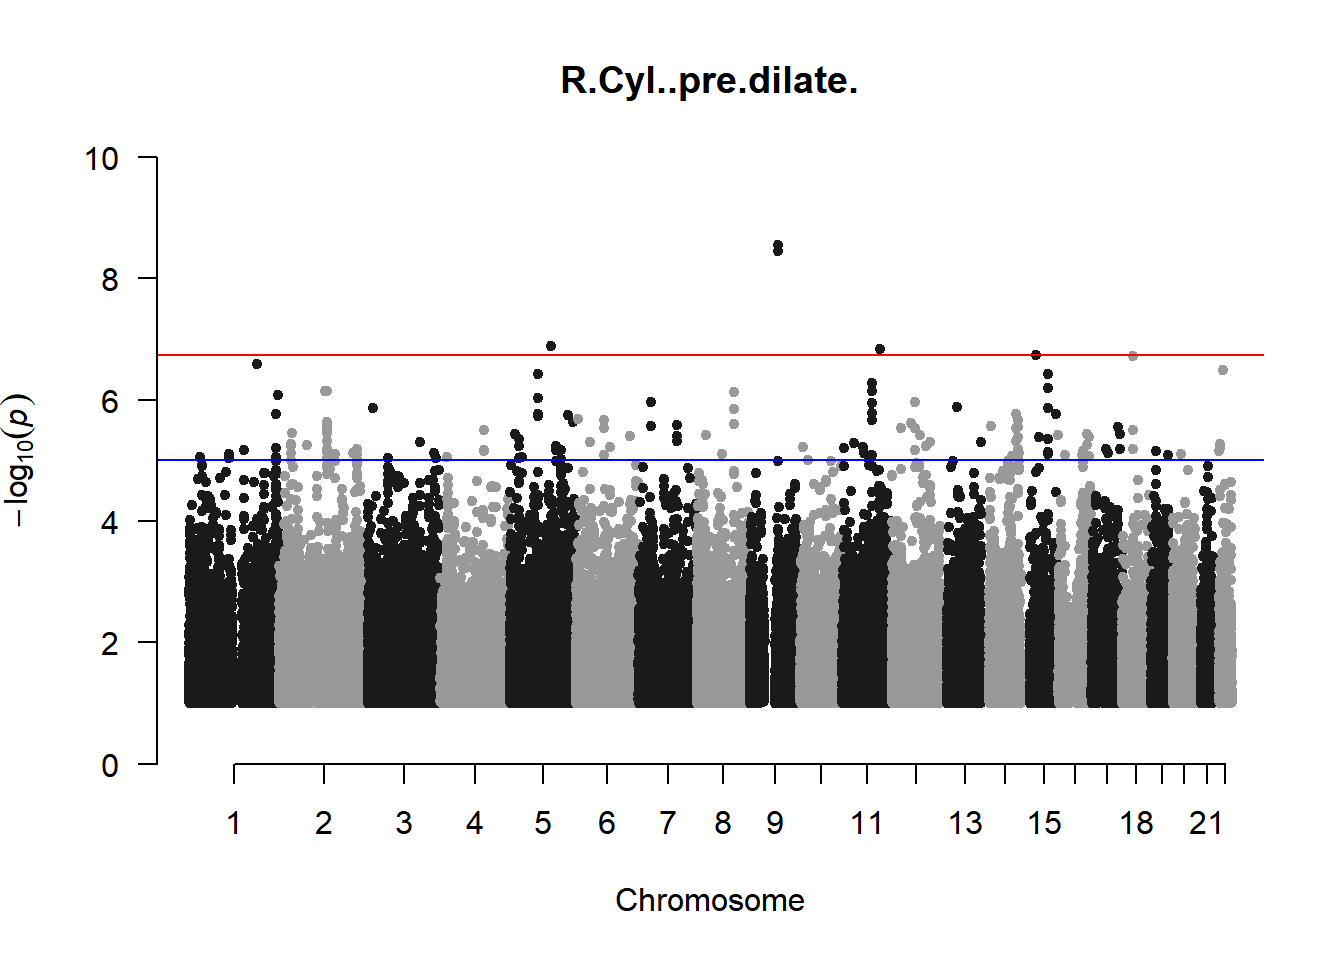
## Warning in trans.X(X, eigenK$vectors[, seq_len(p)], mean(Y)): An intercept
## column was added to the covariate matrix X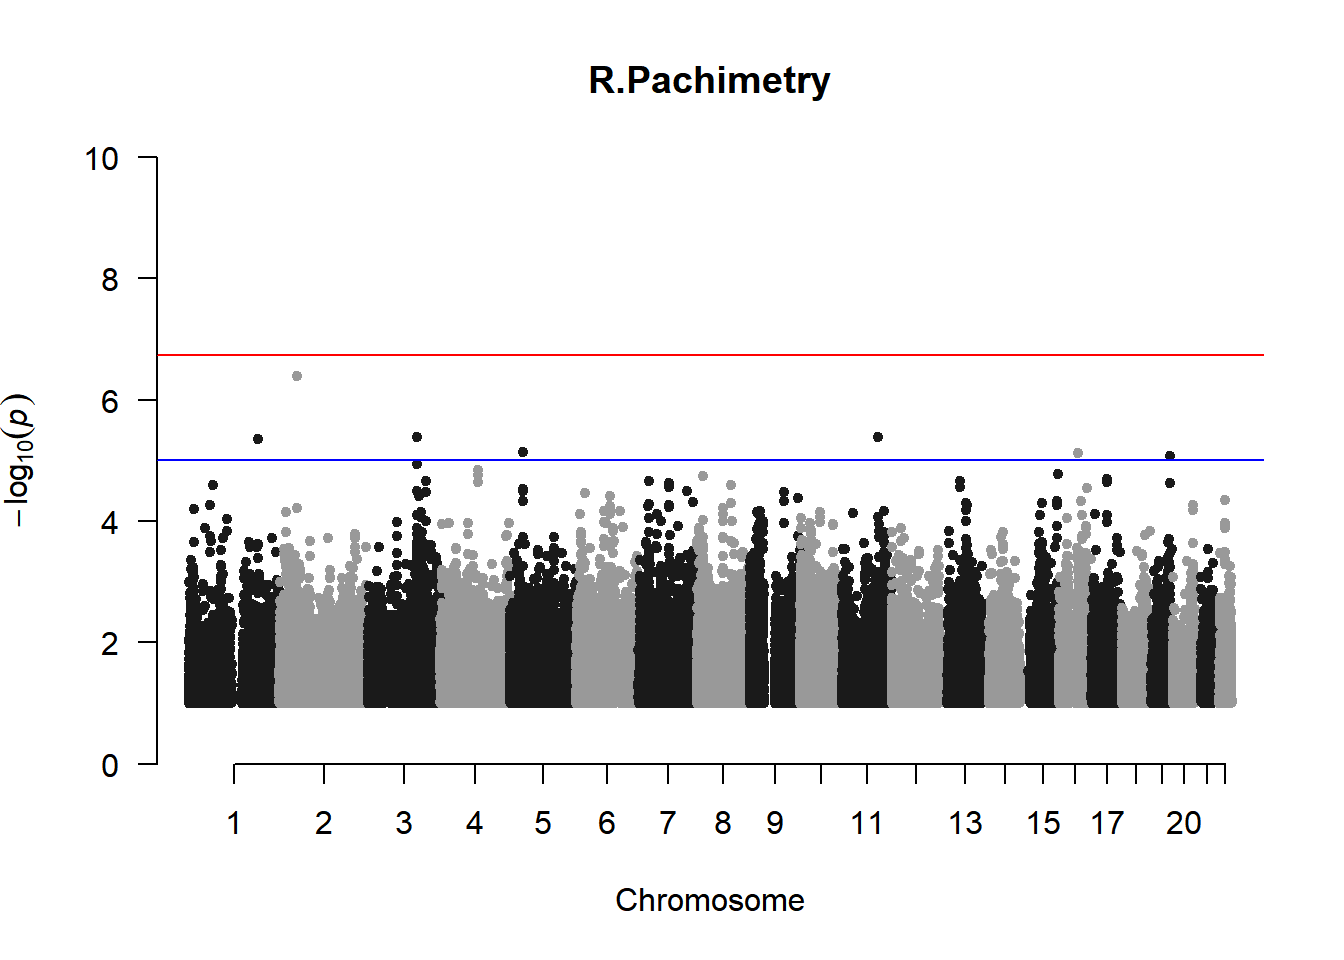
## Warning in trans.X(X, eigenK$vectors[, seq_len(p)], mean(Y)): An intercept
## column was added to the covariate matrix X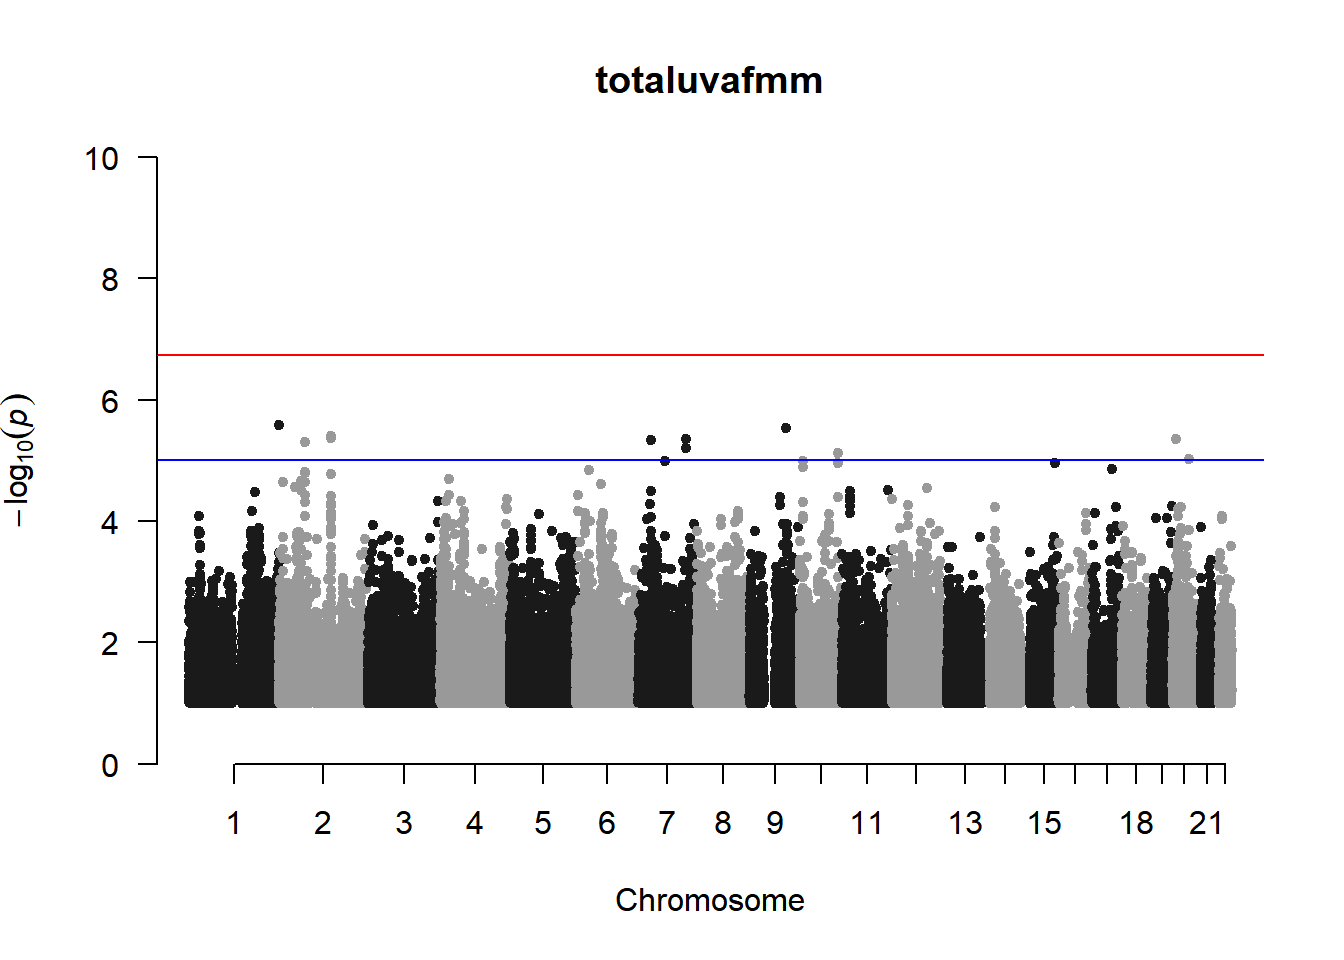
## Warning in trans.X(X, eigenK$vectors[, seq_len(p)], mean(Y)): An intercept
## column was added to the covariate matrix X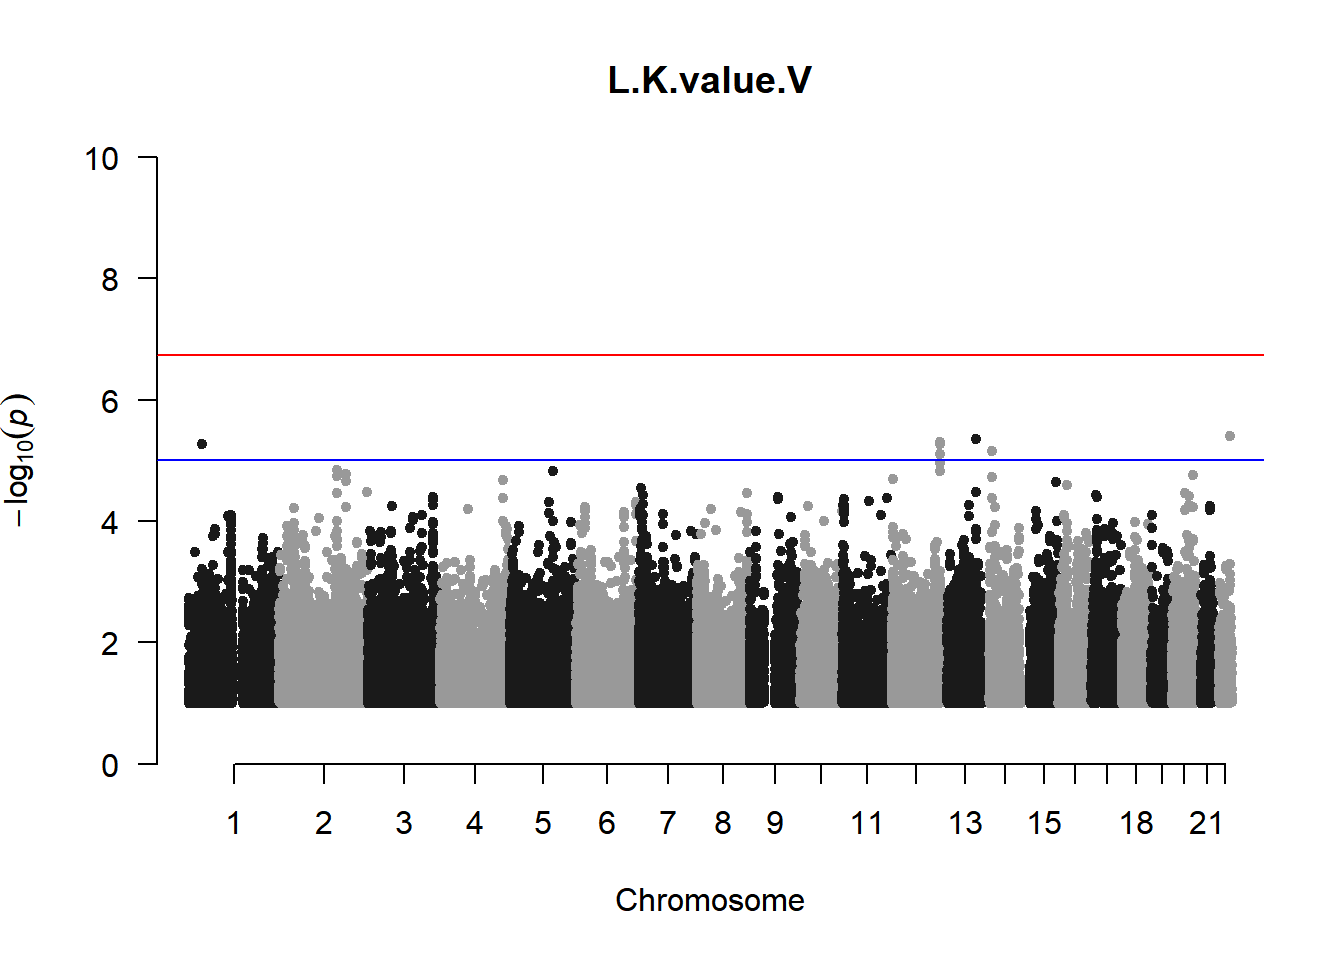
## Warning in trans.X(X, eigenK$vectors[, seq_len(p)], mean(Y)): An intercept
## column was added to the covariate matrix X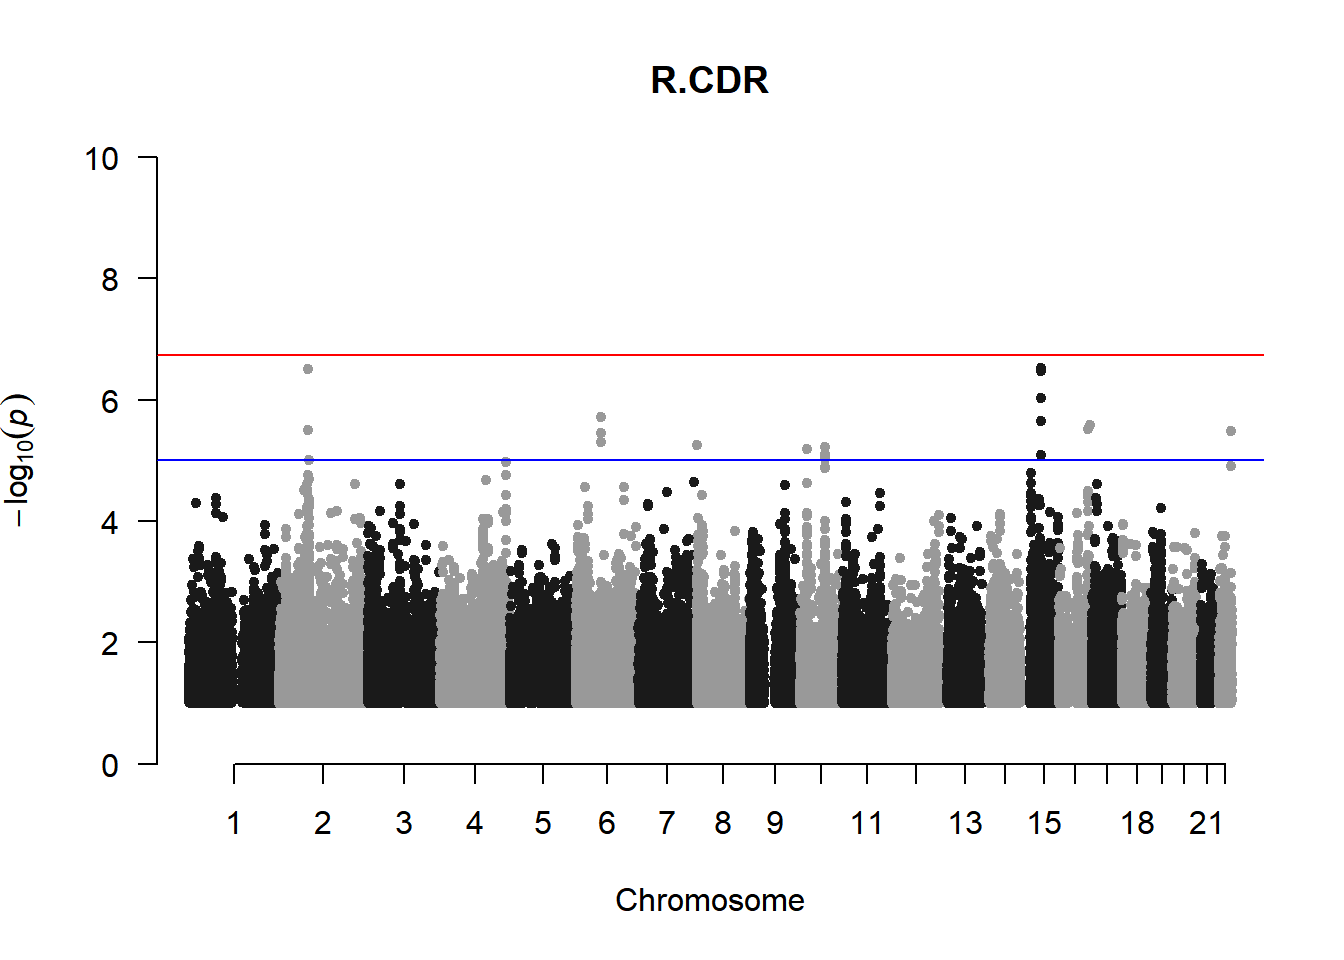
## Warning in trans.X(X, eigenK$vectors[, seq_len(p)], mean(Y)): An intercept
## column was added to the covariate matrix X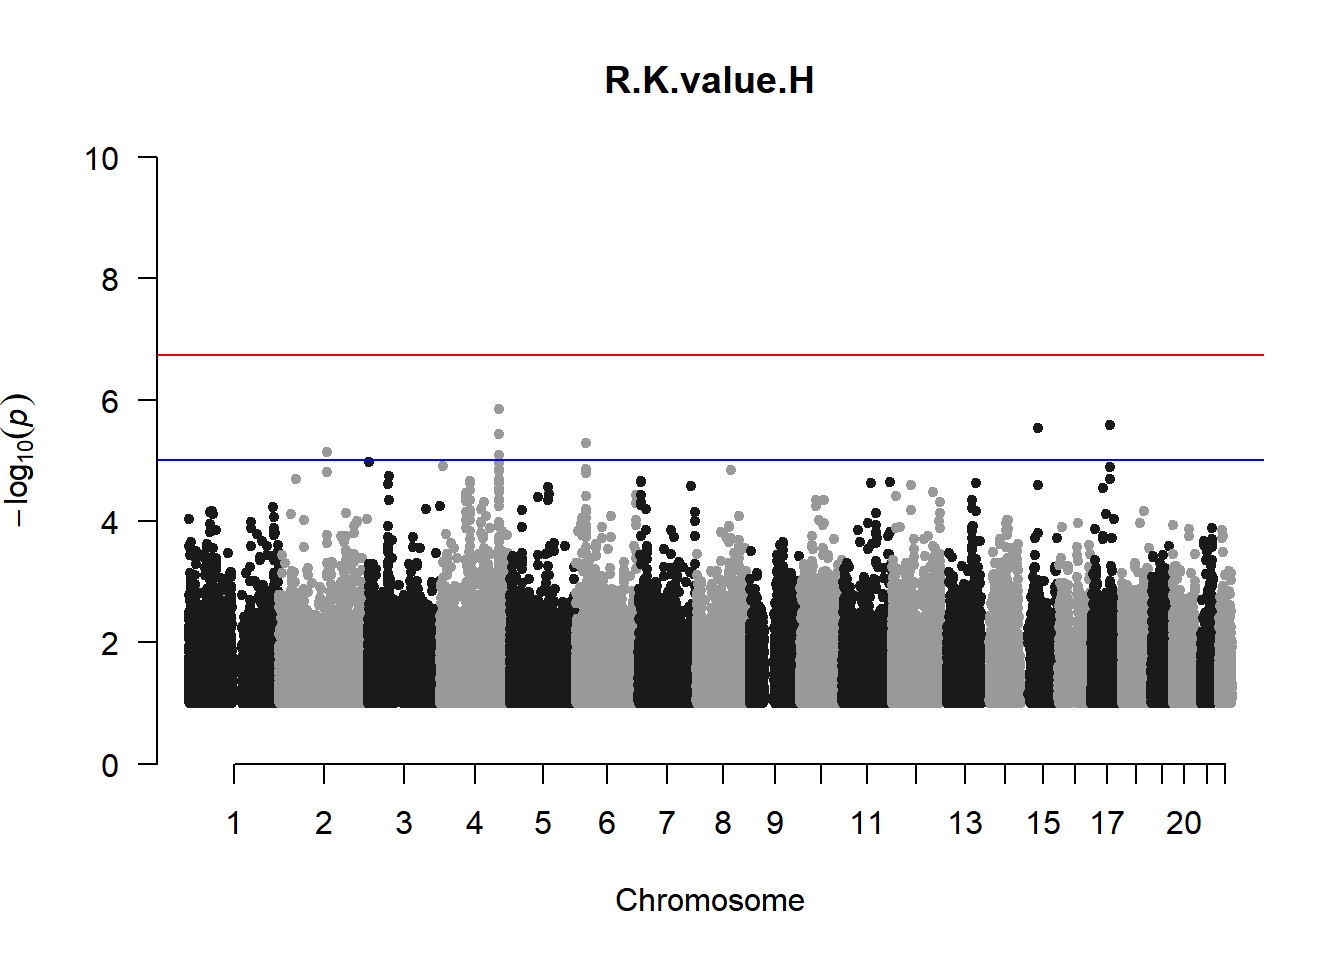
## Warning in trans.X(X, eigenK$vectors[, seq_len(p)], mean(Y)): An intercept
## column was added to the covariate matrix X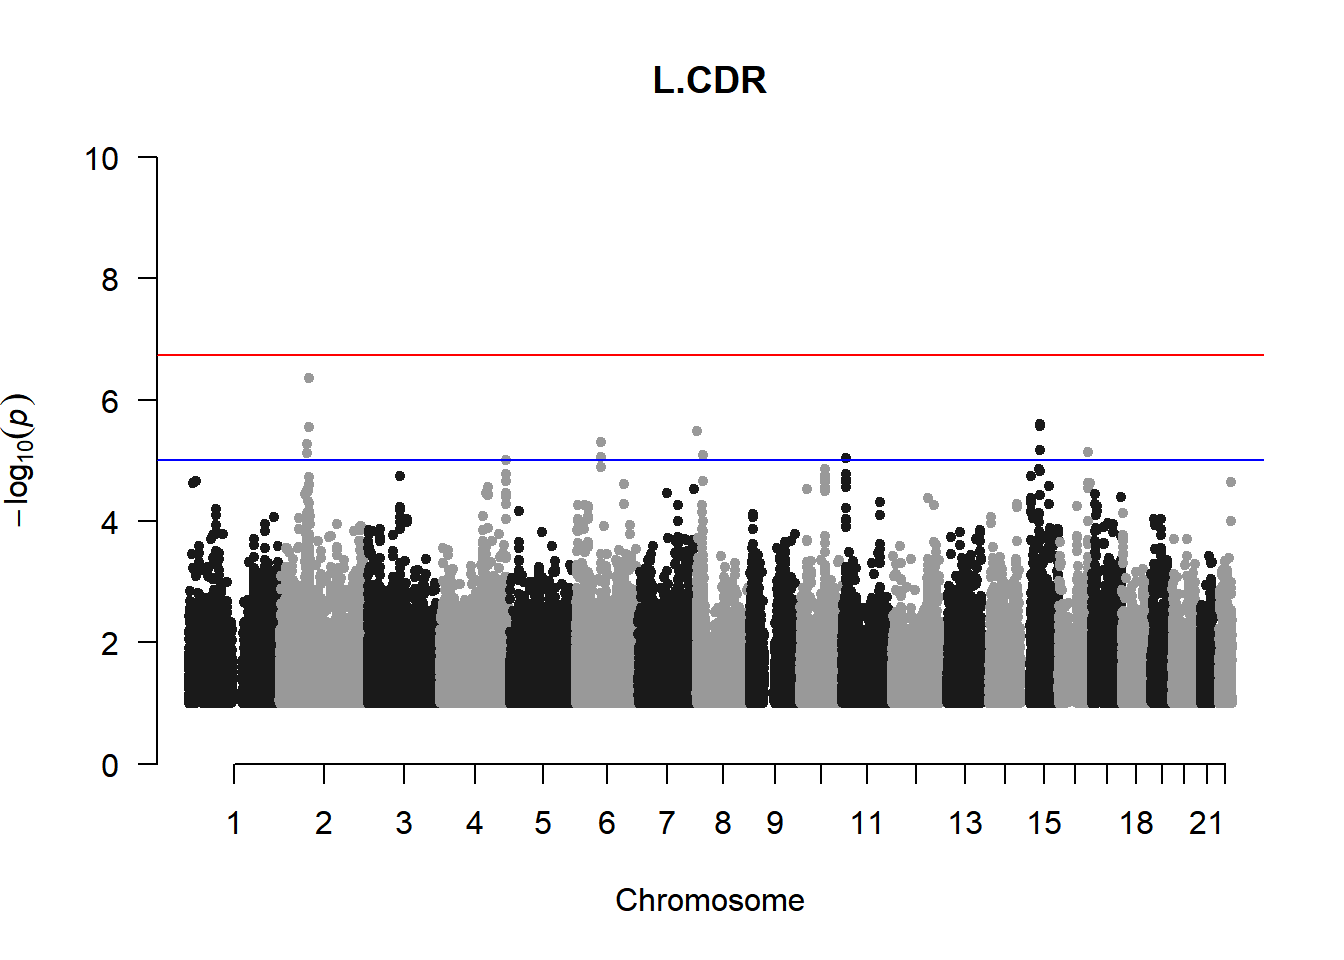
## Warning in trans.X(X, eigenK$vectors[, seq_len(p)], mean(Y)): An intercept
## column was added to the covariate matrix X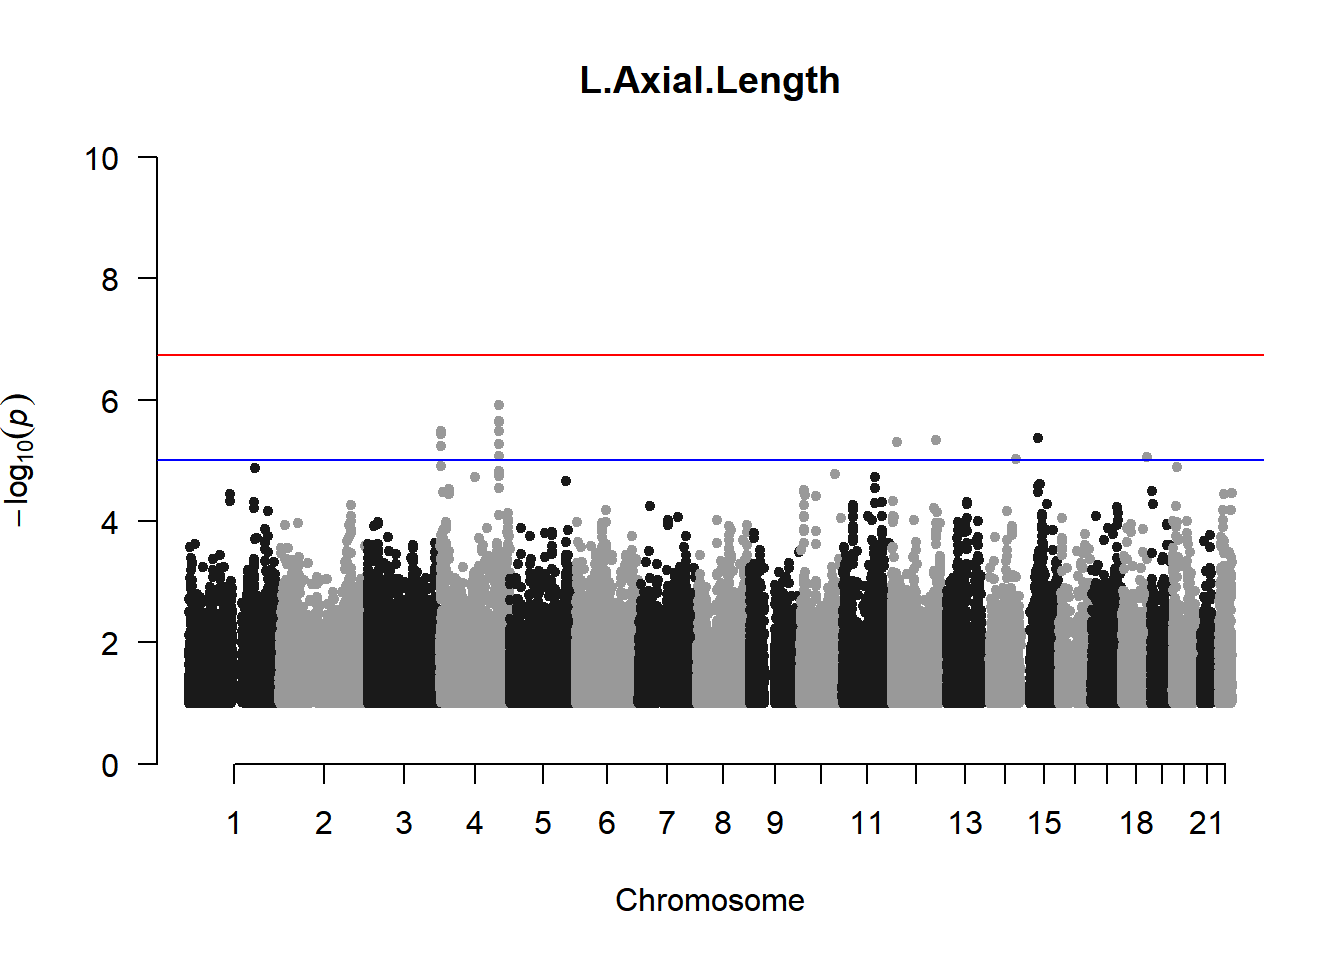
## Warning in trans.X(X, eigenK$vectors[, seq_len(p)], mean(Y)): An intercept
## column was added to the covariate matrix X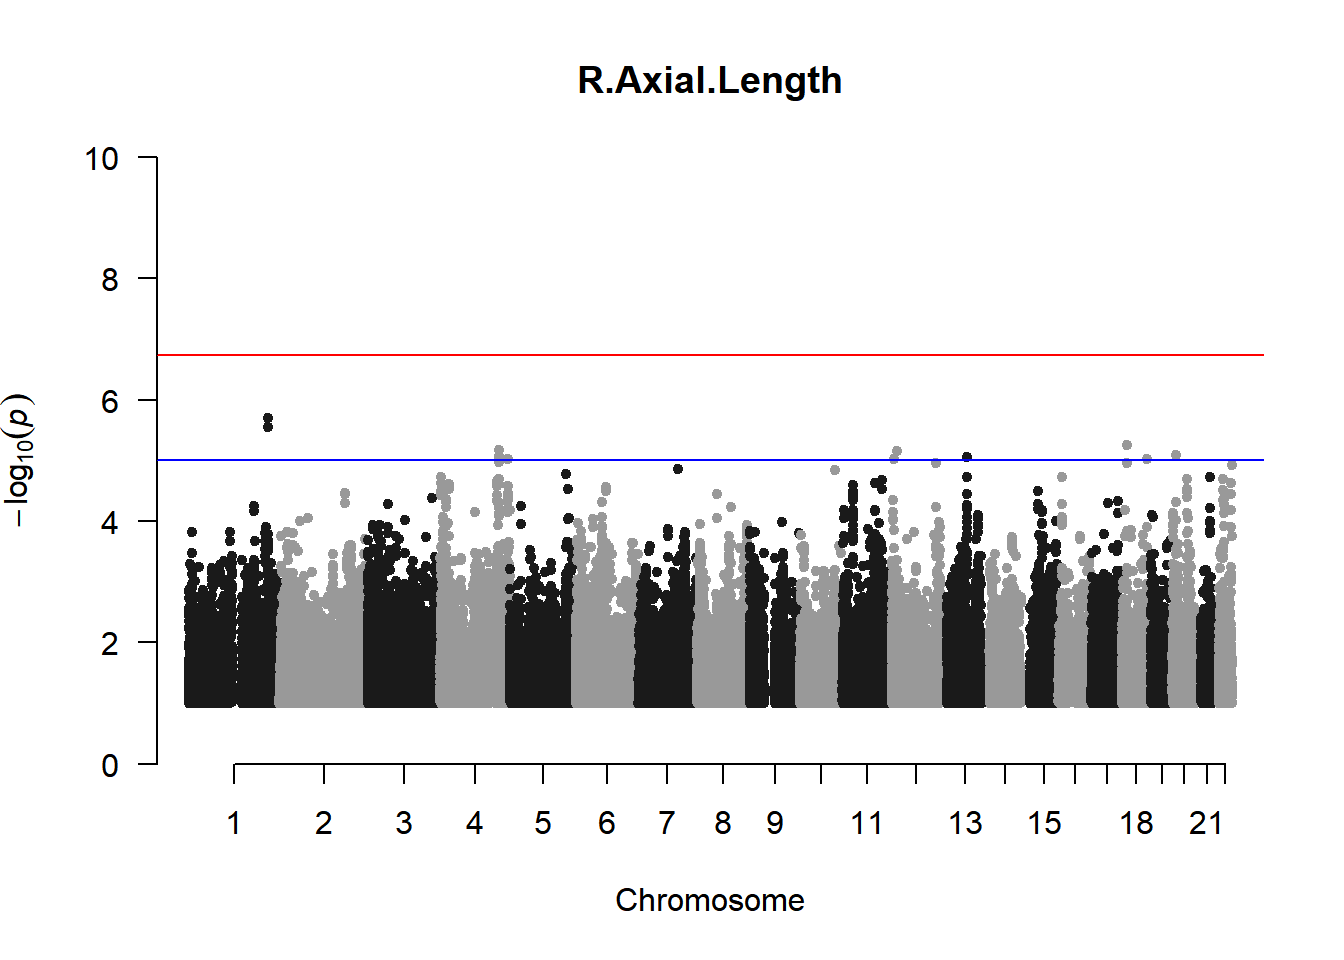
## Warning in trans.X(X, eigenK$vectors[, seq_len(p)], mean(Y)): An intercept
## column was added to the covariate matrix X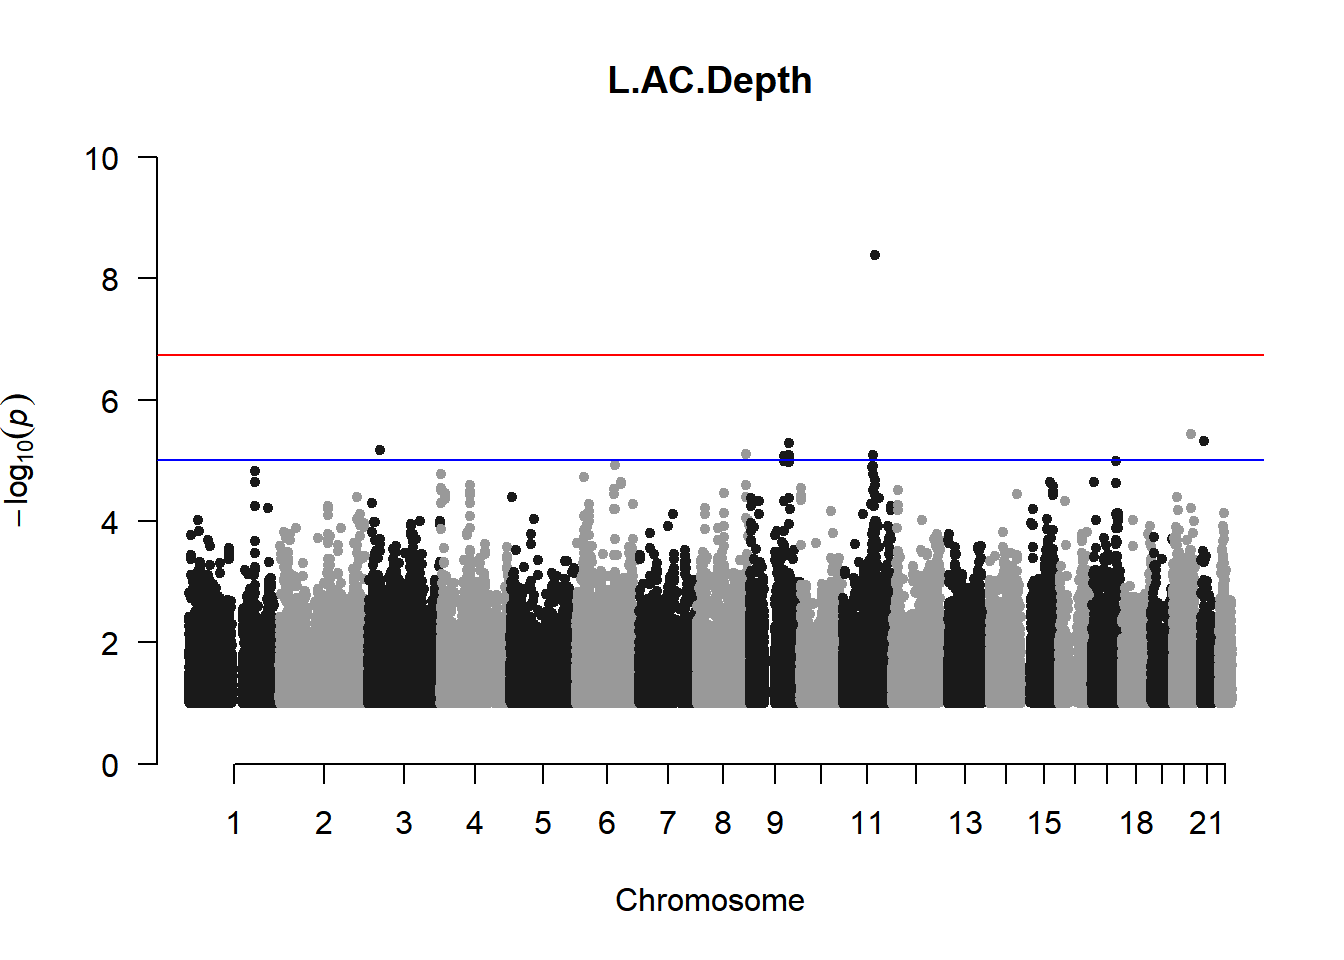
## Warning in trans.X(X, eigenK$vectors[, seq_len(p)], mean(Y)): An intercept
## column was added to the covariate matrix X
## Warning in trans.X(X, eigenK$vectors[, seq_len(p)], mean(Y)): An intercept
## column was added to the covariate matrix X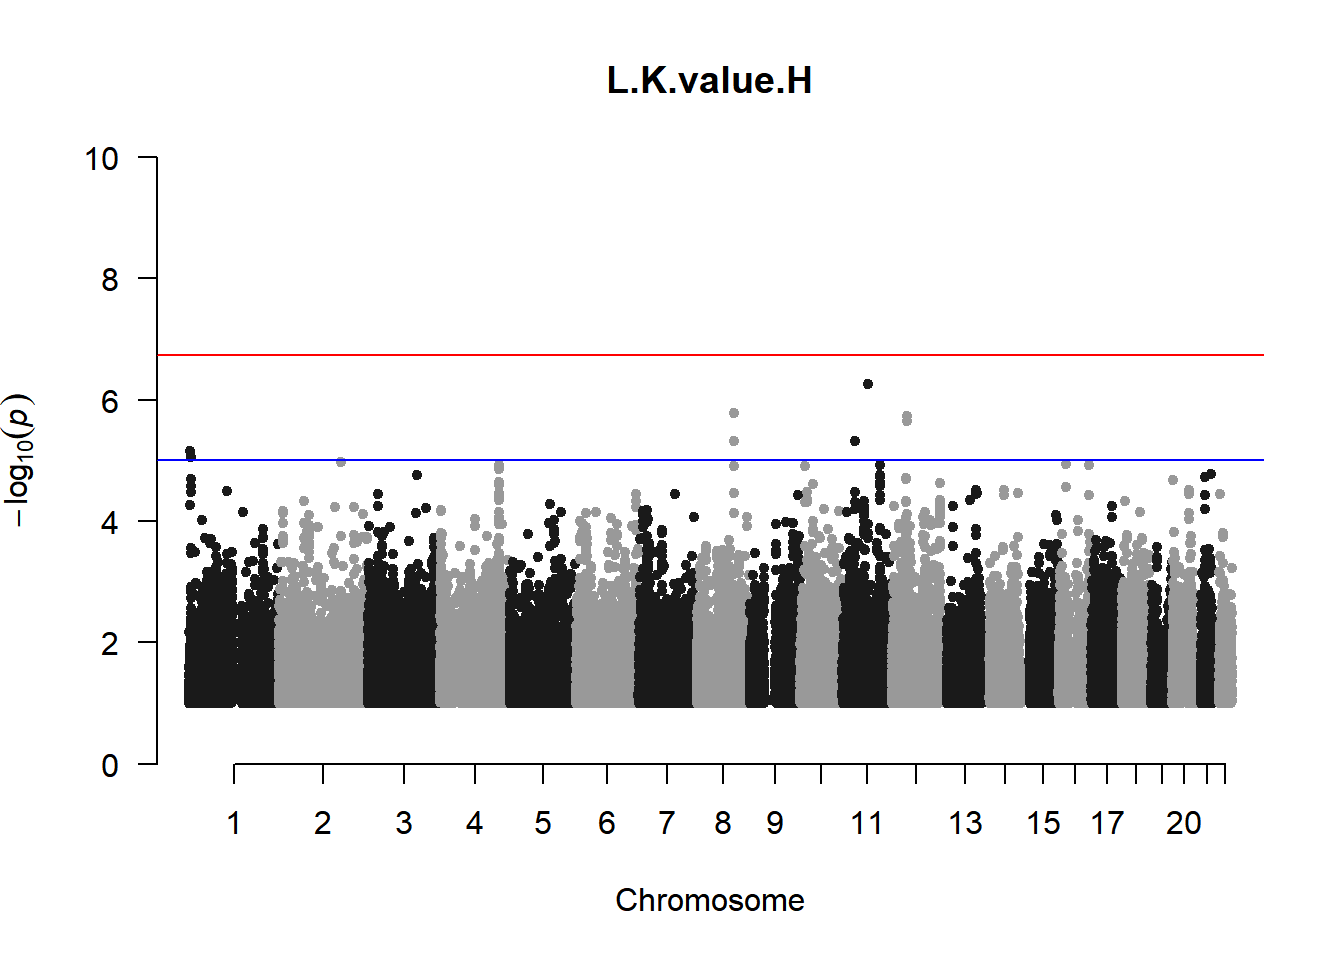
## Warning in trans.X(X, eigenK$vectors[, seq_len(p)], mean(Y)): An intercept
## column was added to the covariate matrix X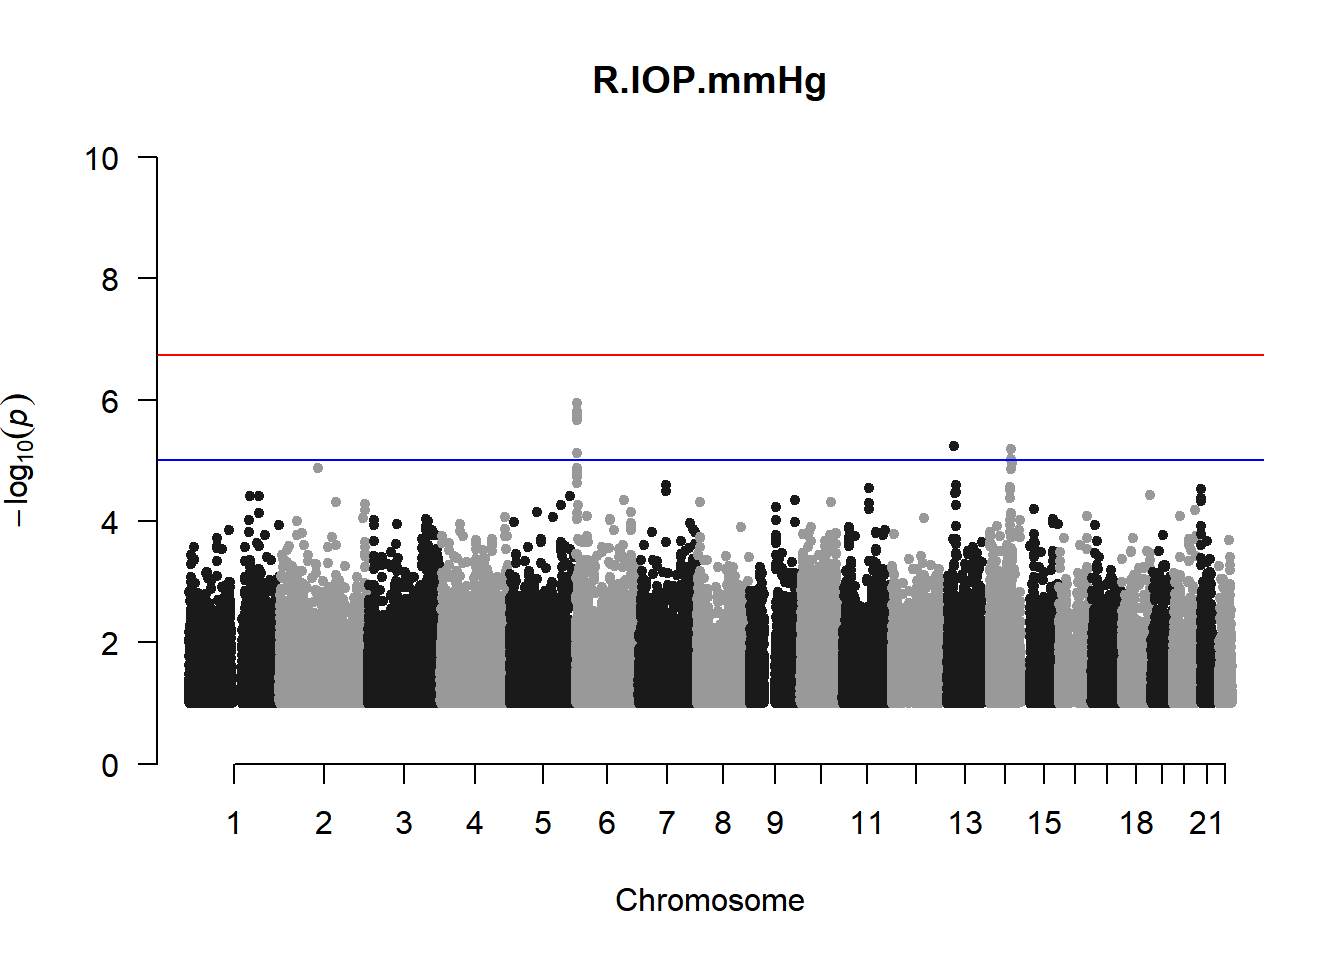
## Warning in trans.X(X, eigenK$vectors[, seq_len(p)], mean(Y)): An intercept
## column was added to the covariate matrix X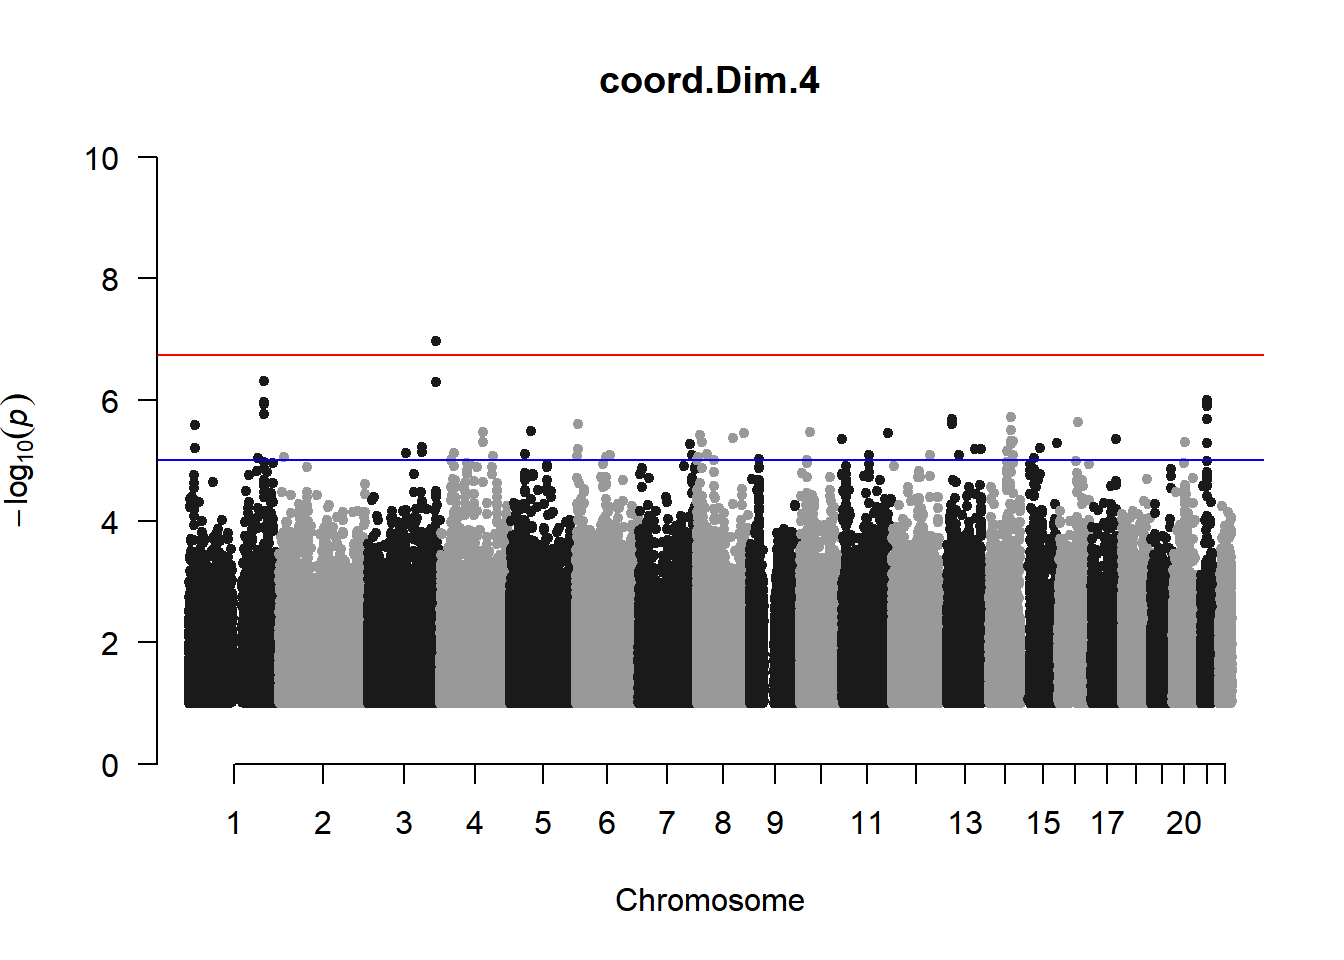
## Warning in trans.X(X, eigenK$vectors[, seq_len(p)], mean(Y)): An intercept
## column was added to the covariate matrix X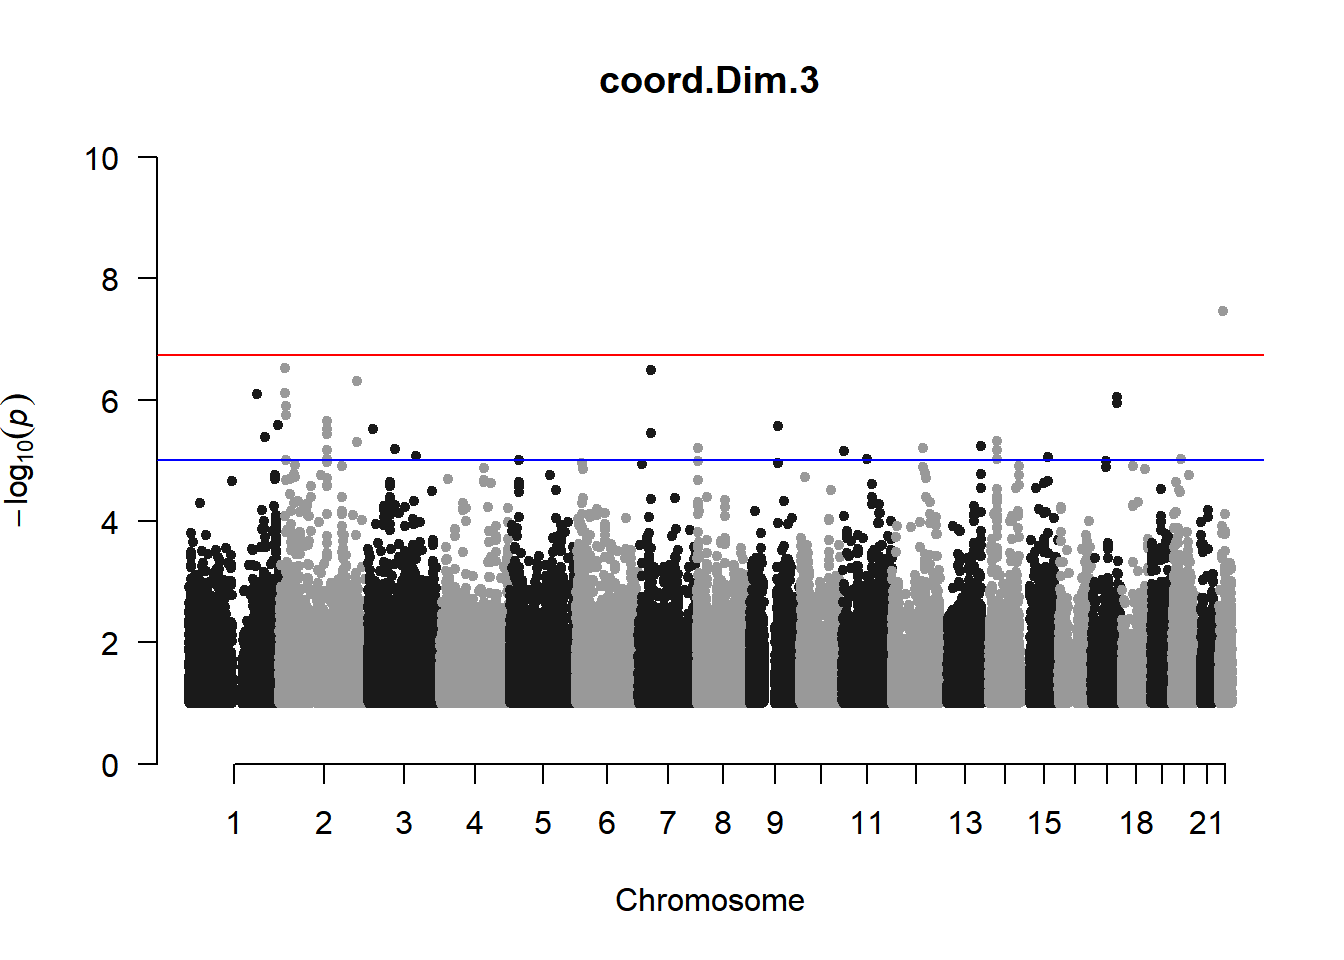
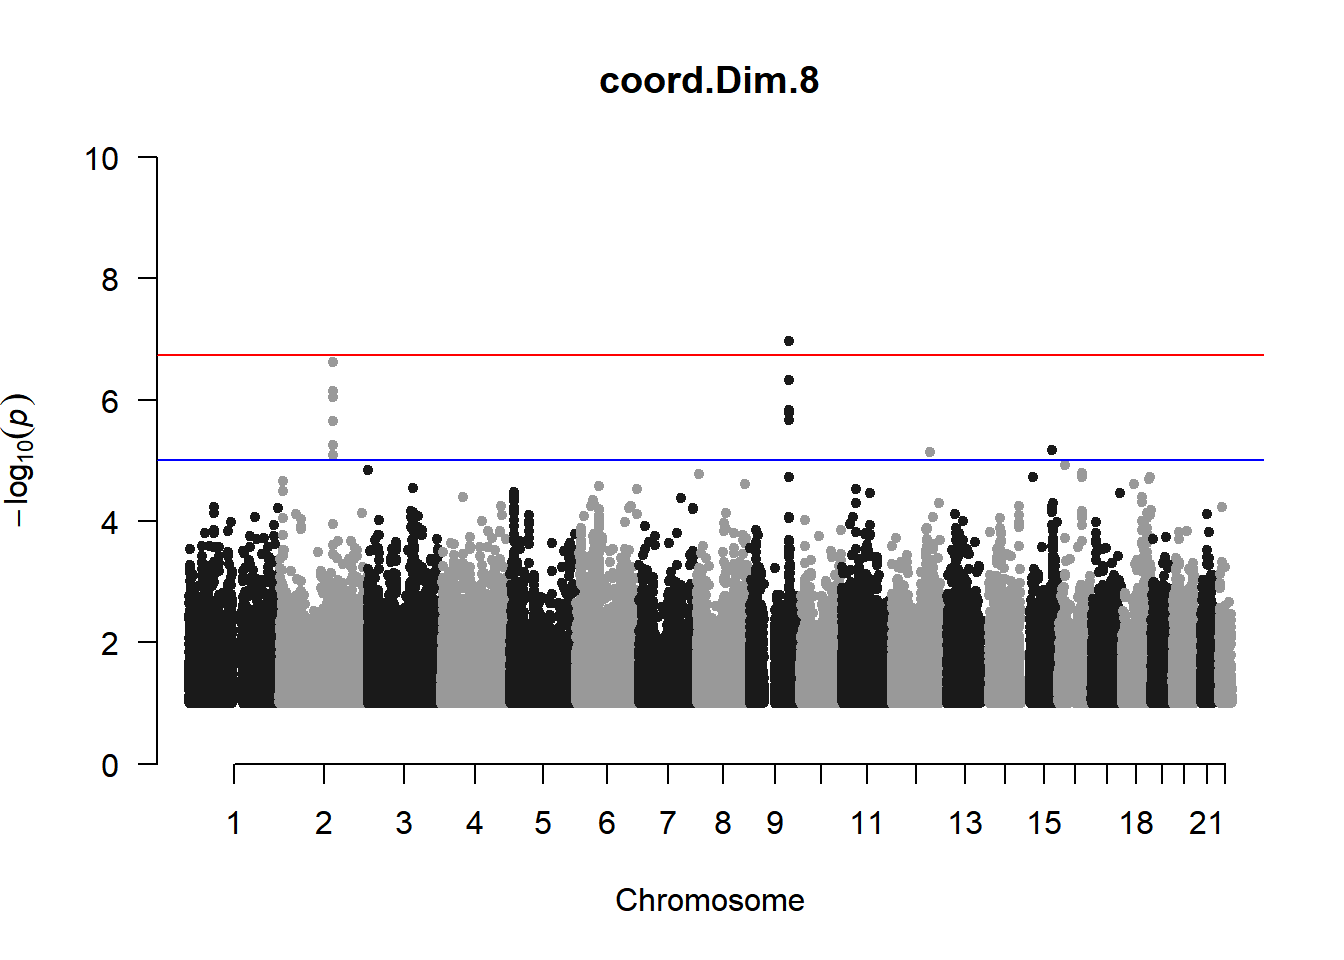
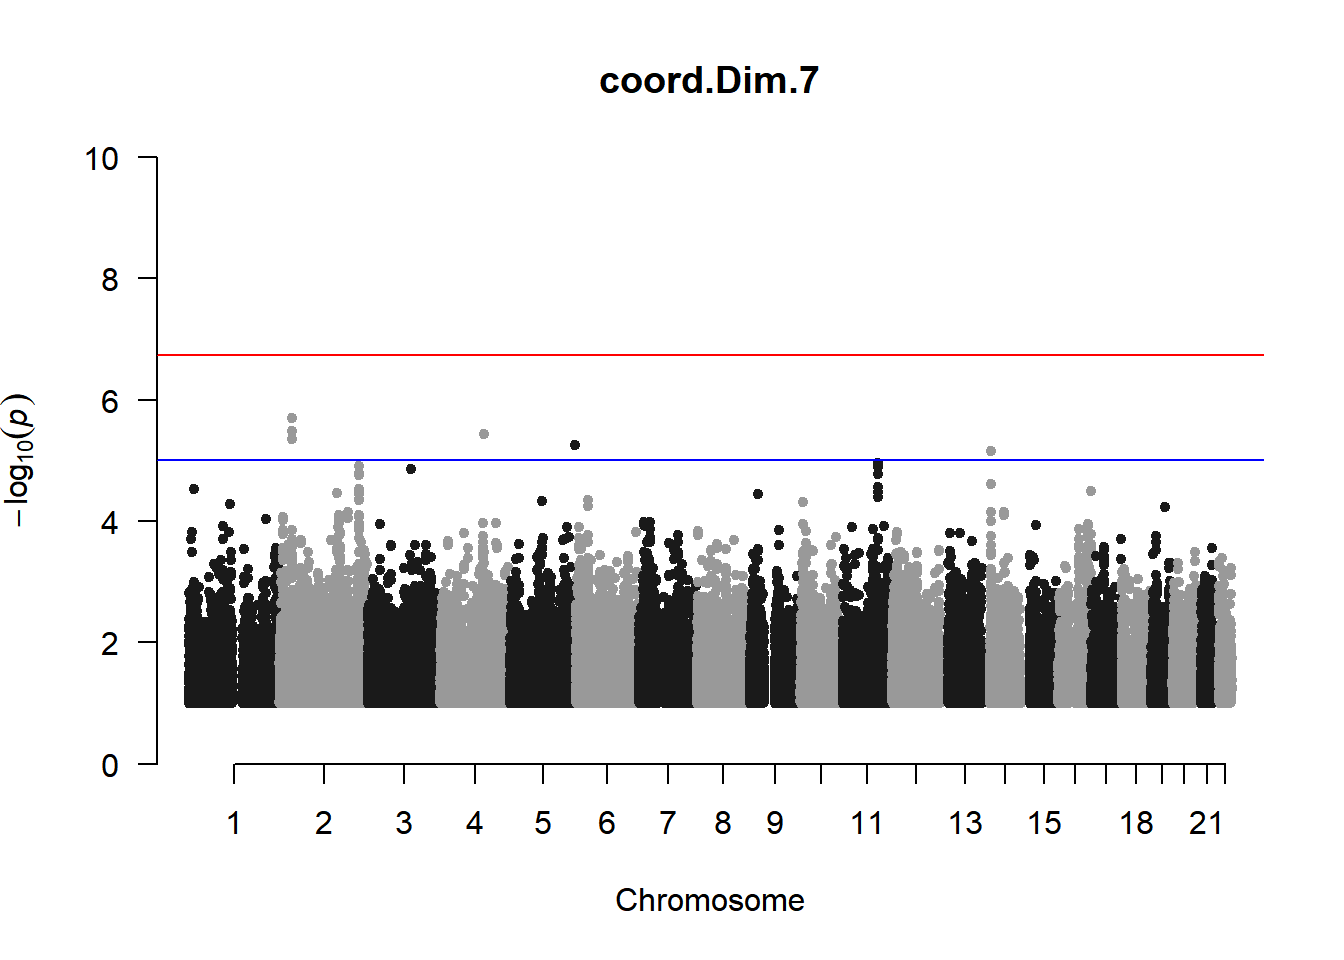
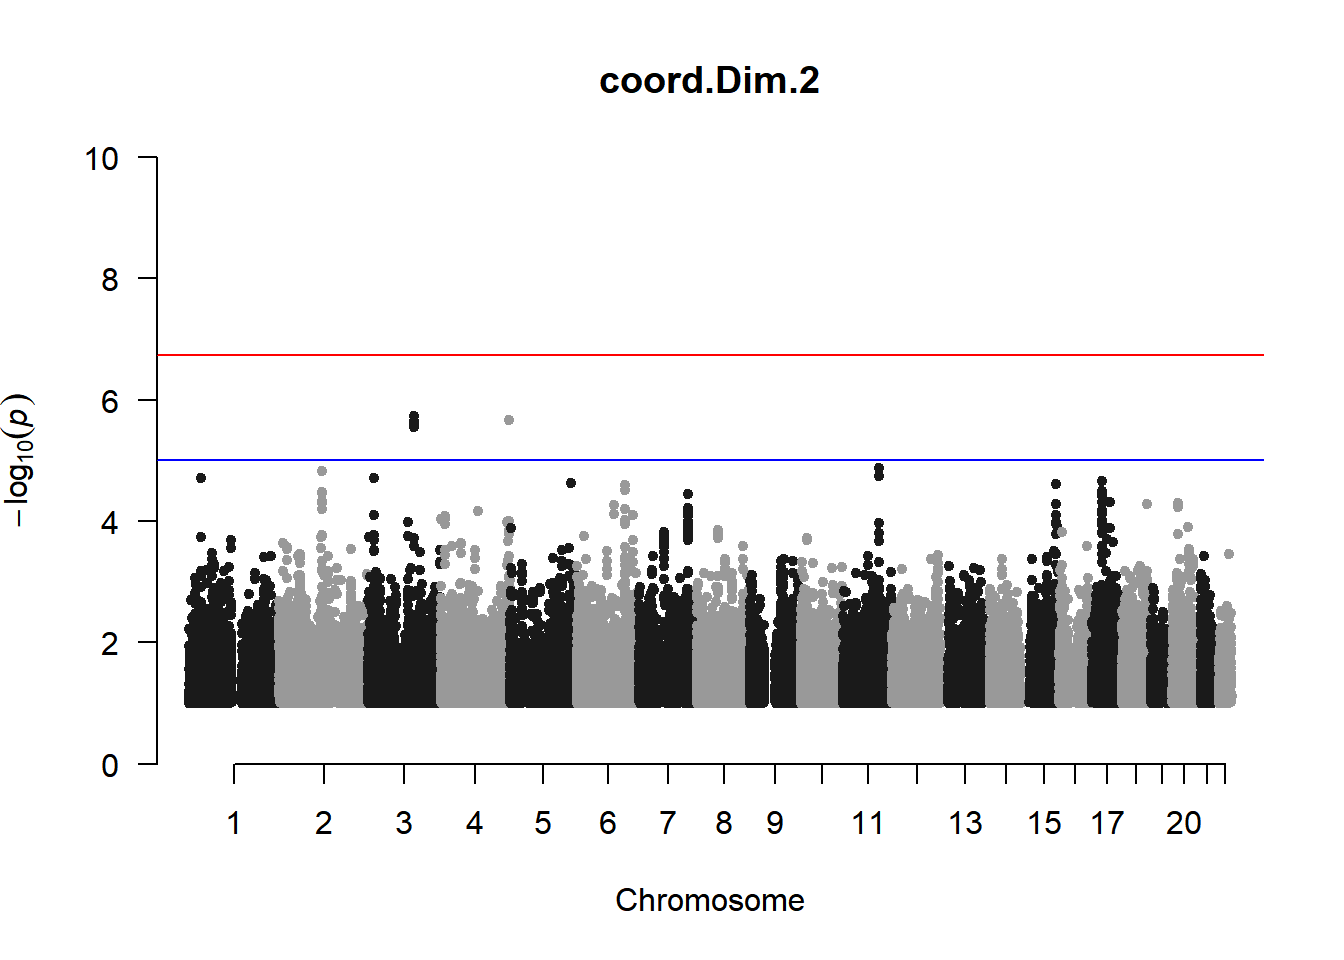
As expected, removing the rare and low frequency variants significantly reduced the number of significantly associated variants.
Interestingly, PCs 1,3, 4, and 8 still show associated variants as well as R Cyl, L ACD, and R ACD. Although these results are yet to be filtered to see whether they are well-supported peaks. In addition, the associated variants previously seen in R KVal V and UVAF were not identified in this round of analysis.