| tags: [ Genomic Data Data Cleaning Linux PLINK R ] categories: [Coding Experiments ]
Extracting genomic data exclusive to NIES
Introduction
After extracting data for the common variants, the last cleaning step is to extract genomic data for NIES individuals only. Unique identifiers are used for individuals and a unique list of UUIDs need to be identified to extract the relevant data.
Methods and Results
- Load .fam file from the merged data set. (.fam file contains UUIDs of individuals with genomic data)
merged_fam_data <- read.table('C:/Users/Martha/Documents/Honours/Project/honours.project/Data/plink_output/common_id_merge.fam', header = F)

head(merged_fam_data)
## V1 V2 V3 V4 V5 V6
## 1 1 110050 764 368910 1 -9
## 2 1 110110 2621 400796 1 -9
## 3 1 110130 2994 2330 1 -9
## 4 1 110150 0 0 2 -9
## 5 1 110160 2070 2071 1 -9
## 6 1 110320 4462 6317 1 -92.Load .csv file that contains UUIDs of NIES individuals that provided DNA samples, either from NIES, NIHS, or both.
nies_with_dna <- read.csv('C:/Users/Martha/Documents/Honours/Project/honours.project/Data/NIES_with_dna.csv', header = T)

head(nies_with_dna)
## UUID IN_NIES NIES DNA_NIES DNA_NIHS
## 1 110150 Yes ES_715 NA 1
## 2 110160 Yes ES_695 NA 1
## 3 110460 Yes ES_006 NA 1
## 4 110490 Yes ES_591 NA 1
## 5 110500 Yes ES_555 NA 1
## 6 110590 Yes ES_686 NA 1Note: prior to loading this data, the original ID file contained UUIDs for ALL NIES and/or NIHS individuals. I selected the UUIDs for NIES individuals only, and then filtered ONLY for individuals that provided DNA. I.e. there were 801 individuals in the NIES, of which 632 individuals provided DNA, so I only obtained the UUIDs for the 632 individuals.
3.Assign column names/labels to data from the .fam file. This is important so that the two lists can be easily merged.
colnames(merged_fam_data) <- c("Fam ID", "UUID", "Pat ID", "Mat ID", "Sex", "Affection")

head(merged_fam_data)
## Fam ID UUID Pat ID Mat ID Sex Affection
## 1 1 110050 764 368910 1 -9
## 2 1 110110 2621 400796 1 -9
## 3 1 110130 2994 2330 1 -9
## 4 1 110150 0 0 2 -9
## 5 1 110160 2070 2071 1 -9
## 6 1 110320 4462 6317 1 -94.Merge two lists to obtain unique UUIDs.
nies_with_geno <- merge(nies_with_dna, merged_fam_data, by="UUID")

head(nies_with_geno)
## UUID IN_NIES NIES DNA_NIES DNA_NIHS Fam ID Pat ID Mat ID Sex
## 1 110150 Yes ES_715 NA 1 1 0 0 2
## 2 110160 Yes ES_695 NA 1 1 2070 2071 1
## 3 110500 Yes ES_555 NA 1 1 3185 400162 2
## 4 110650 Yes ES_225 NA 1 1 400226 362911 2
## 5 110820 Yes ES_629 NA 1 1 400184 1910 2
## 6 111280 Yes ES_257 1 1 1 933 59 2
## Affection
## 1 -9
## 2 -9
## 3 -9
## 4 -9
## 5 -9
## 6 -9The output from this step indicates that there is an overlap of 362 individuals, suggesting that there are 362 individuals within the NIES with both phenotypic and genomic data.
5.Extract Family IDs and UUIDs only because PLINK requires both to extract data based on indiv IDs
nies_geno_id <- cbind(nies_with_geno$`Fam ID`, nies_with_geno$UUID)
head(nies_geno_id)
## [,1] [,2]
## [1,] 1 110150
## [2,] 1 110160
## [3,] 1 110500
## [4,] 1 110650
## [5,] 1 110820
## [6,] 1 1112806.Export to .txt file for use in PLINK
write.table(nies_geno_id, 'C:/Users/Martha/Documents/Honours/Project/honours.project/nies_geno_id.txt', col.names = F, row.names = F)7.Extract relevant genomic data in PLINK
plink1.9 --bfile plink_output/common_id_merge --keep nies_geno_id.txt --make-bed --out plink_output/nies_only_genoThis last line in PLINK extracted the genomic data (5, 789,188 variants) for the 362 NIES individuals. The total genotyping rate for this data set is 96.38%.
This extracted data is the final data set that will be used for subsequent analyses. The phenotypic data will also be restricted to these individuals only.
8.Generate allele frequency statistic for the NIES only genomic data
plink1.9 --bfile plink_output/nies_only_geno --freq --out plink_output/nies_allele_freq9.Load allele frequency file from PLINK
nies_only_geno <- read.table('C:/Users/Martha/Documents/Honours/Project/honours.project/Data/plink_output/nies_allele_freq.frq', header = T)
head(nies_only_geno)
## CHR SNP A1 A2 MAF NCHROBS
## 1 1 rs62637813 C G 0.00000 50
## 2 1 rs141149254 A G 0.00000 22
## 3 1 rs2462492 T C 0.07143 14
## 4 1 rs76735897 G A 0.37500 8
## 5 1 rs77573425 C G 0.37500 8
## 6 1 rs28850140 A G 0.00000 3210.Visualise allele frequency distributions in this data set.
hist(nies_only_geno$MAF, main = "Allele Frequency Distributions of Genomic Data for NIES", xlab = "Minor Allele Frequency", xlim = c(0.0, 0.5), col = "plum")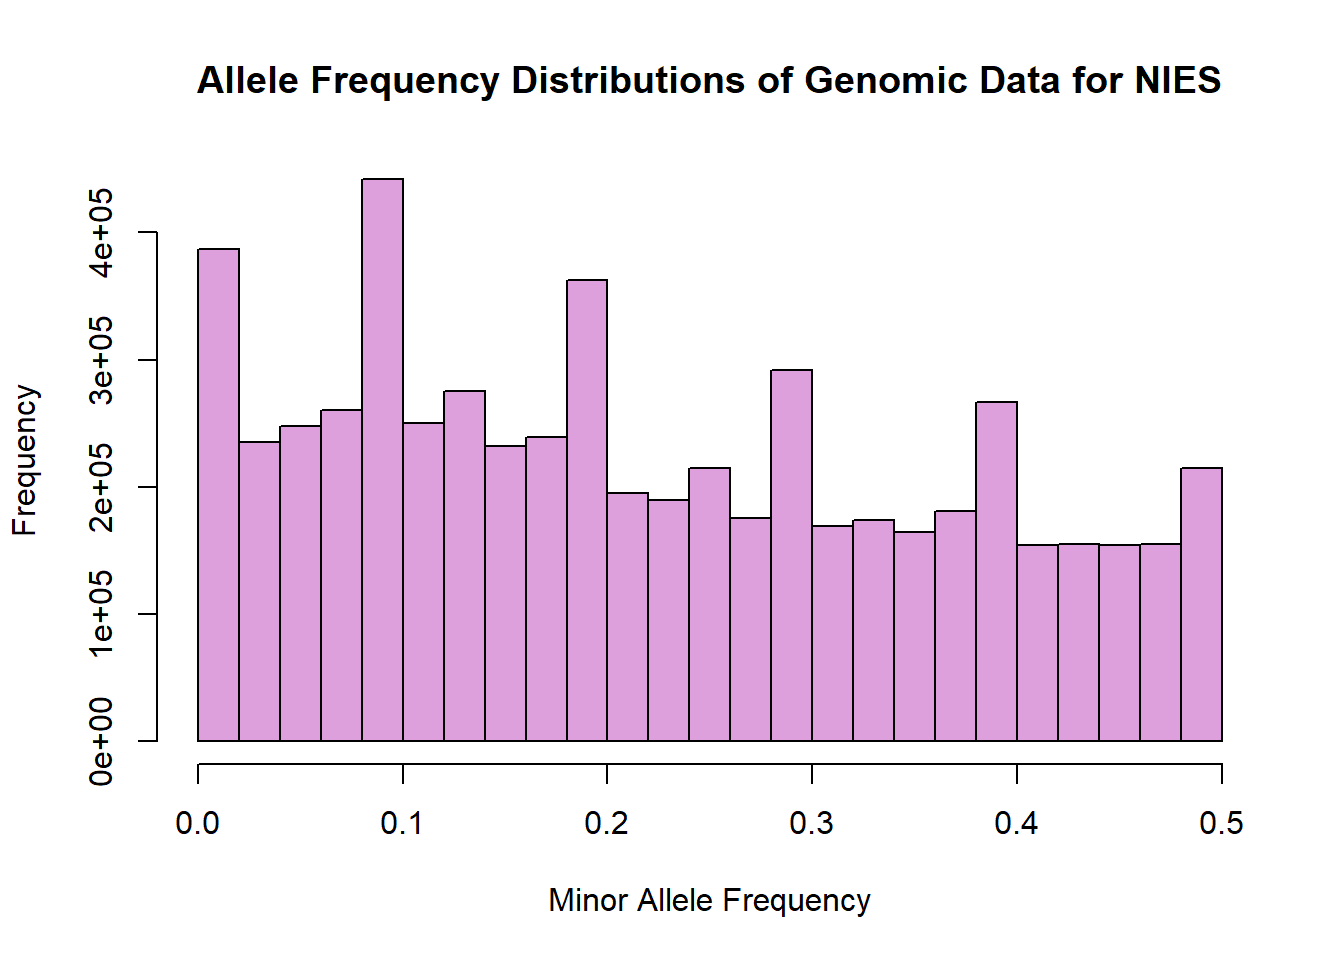
11.Generate missingness statistics for NIES only data set
plink1.9 --bfile plink_output/nies_only_geno --missing --out plink_output/nies_missingThis exercise concludes the cleaning step for the genomic data. I have extracted the relevant information by including only the common variants across both WGS and SNP-array data sets, and only including NIES individuals. This has resulted in a final data set that includes 5,789,188 variants and 362 individuals. More detailed analysis of basic statistics generated at different points will follow.
Note: 362 individuals was more than I expected. I thought that of the NIES individuals, 238 had SNP-array data and 86 had WGS data, which is a total of 324, including overlaps. After exclusion of these overlaps, I was expecting 301 individuals.