| tags: [ Genomic Data Linux PLINK R ] categories: [Coding Experiments ]
Generating basic statistics for merged data set
Introduction
Error when extracting common variant IDs needs to be resolved.
After successfully exporting the list of common IDs, the relevant genomic data will need to be extracted and basic statistics will need to be generated.
Methods and results
I believe the error in PLINK when extracting data is due to the formatting of the IDs in the text file.
1.Try removing quotation marks from the list of IDs
write.table(merged_rsID, file = 'C:/Users/Martha/Documents/Honours/Project/honours.project/Data/merged_rsID.txt', row.names = F, col.names = F, quote = F)2.Check that the quotation marks were removed
head merged_rsID.txt3.Use exported ID list to extract data
plink1.9 --bfile plink_output/var_out_merge --extract merged_rsID.txt --make-bed --out plink_output/common_id_mergeNote: var_out_merge is the file set that contains 30million+ variants and had the variants with 3+ alleles removed
This was successful, and the output indicates that new file set contains 5,789,188 variants with 614 individuals.
4.Find allele frequency for new file set.
plink1.9 --bfile plink_output/common_id_merge --freq --out plink_output/merged_allele_freqOutput: genotyping rate is 97.02%.
5.Generate missingness stats
plink1.9 --bfile plink_output/common_id_merge --missing --out plink_output/merged_missingVisualise allele frequency distributions.
6.Load allele frequency files for the original file sets
wgs_allele_freq <- read.table('C:/Users/Martha/Documents/Honours/Project/honours.project/Data/plink_output/wgs_allele_freq.frq', header = T)

snp_allele_freq <- read.table('C:/Users/Martha/Documents/Honours/Project/honours.project/Data/plink_output/snp_allele_freq.frq', header = T)
7.Generate histograms
hist(wgs_allele_freq$MAF, main = "Allele Frequency Distributions of WGS Data", xlab = "Minor Allele Frequency", xlim = c(0.0, 0.5), col = "darkseagreen1")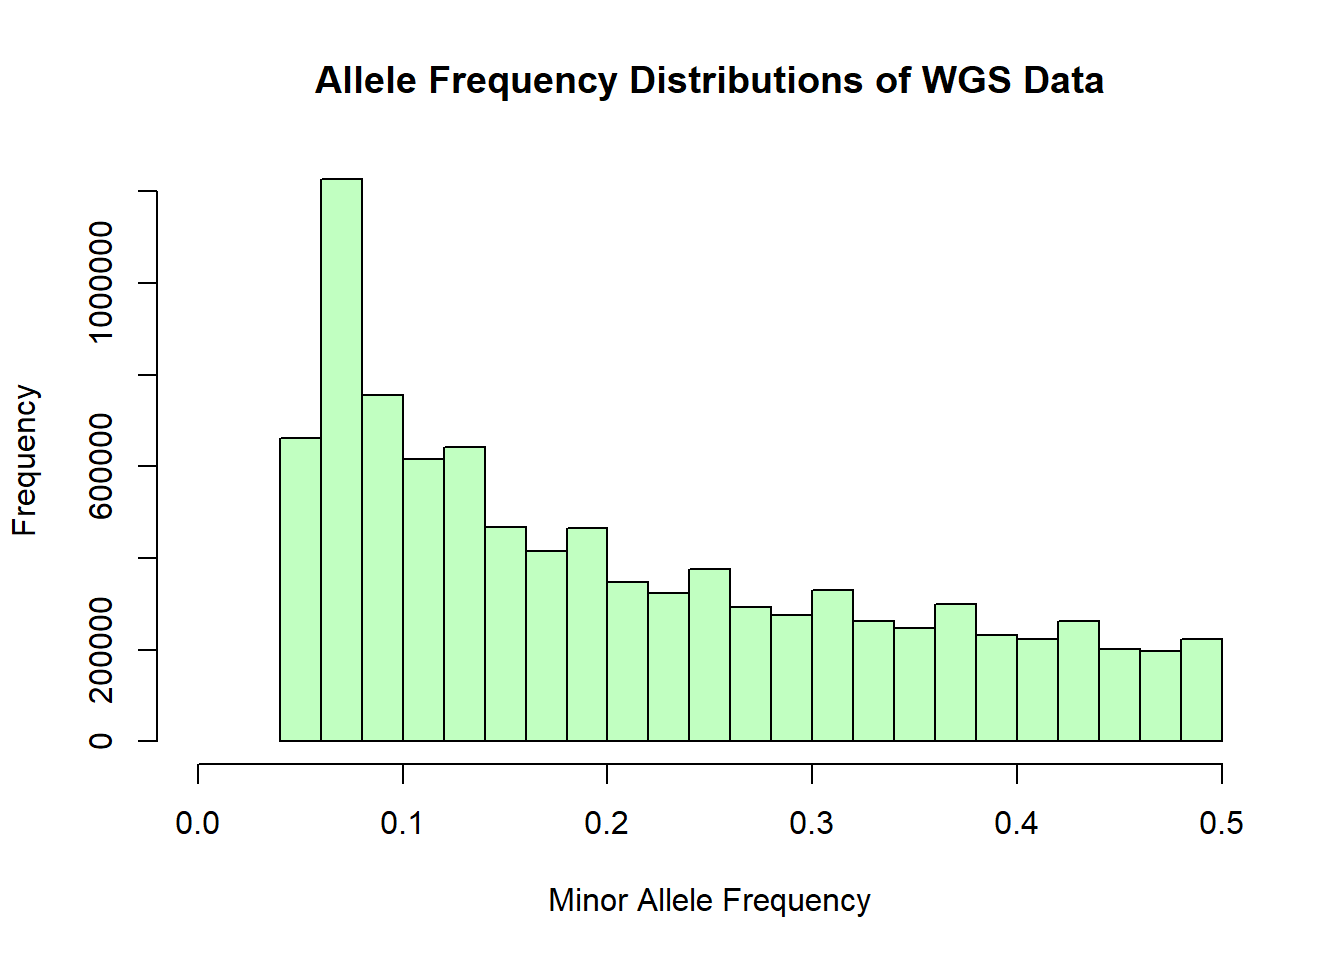
hist(snp_allele_freq$MAF, main = "Allele Frequency Distribution of SNP Data", xlab = "Minor Allele Frequency", xlim = c(0.0, 0.5), col = "cadetblue1")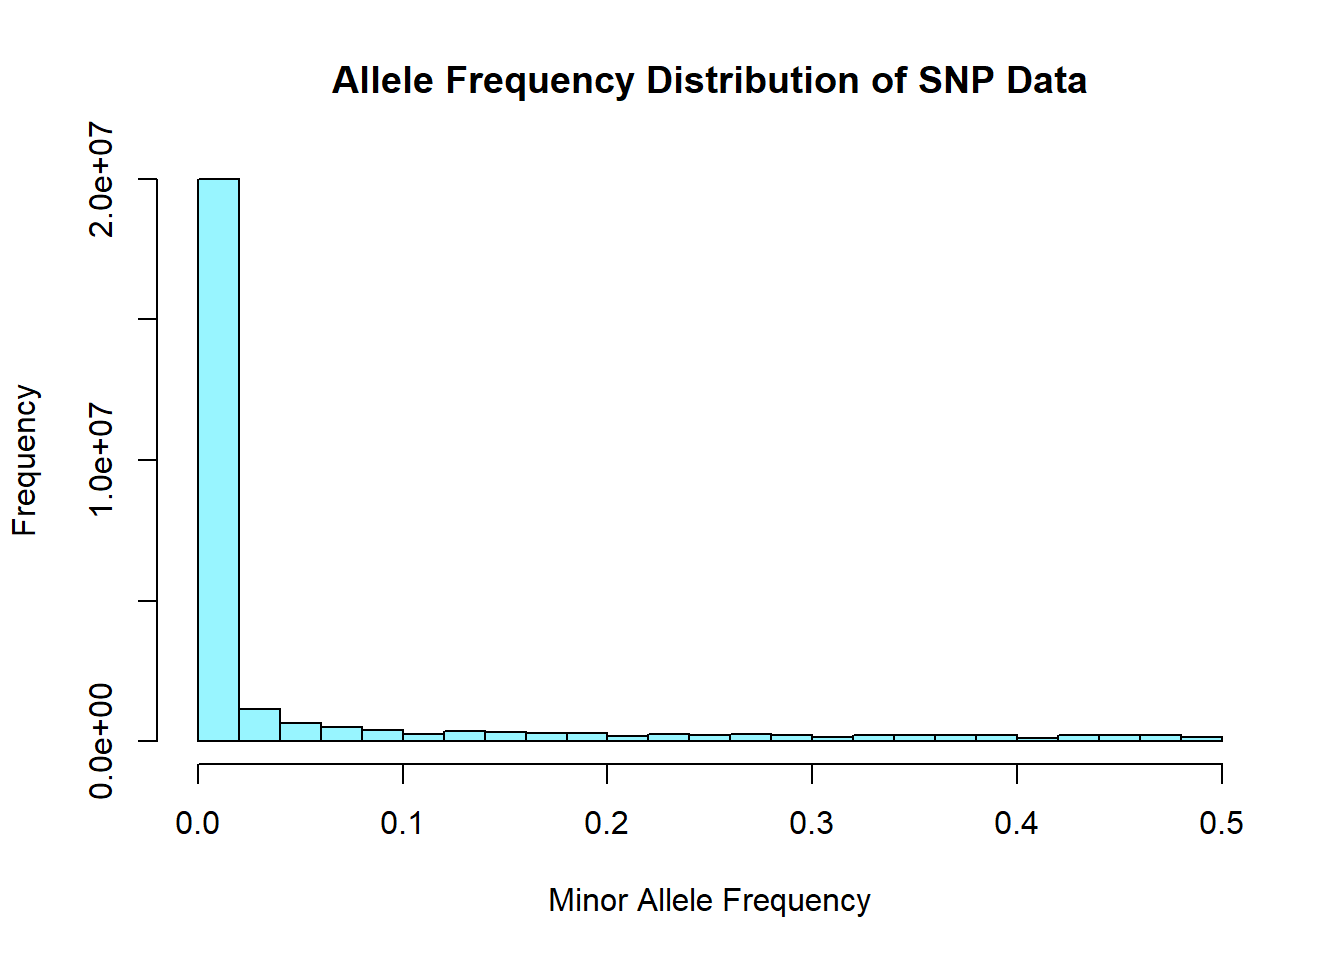
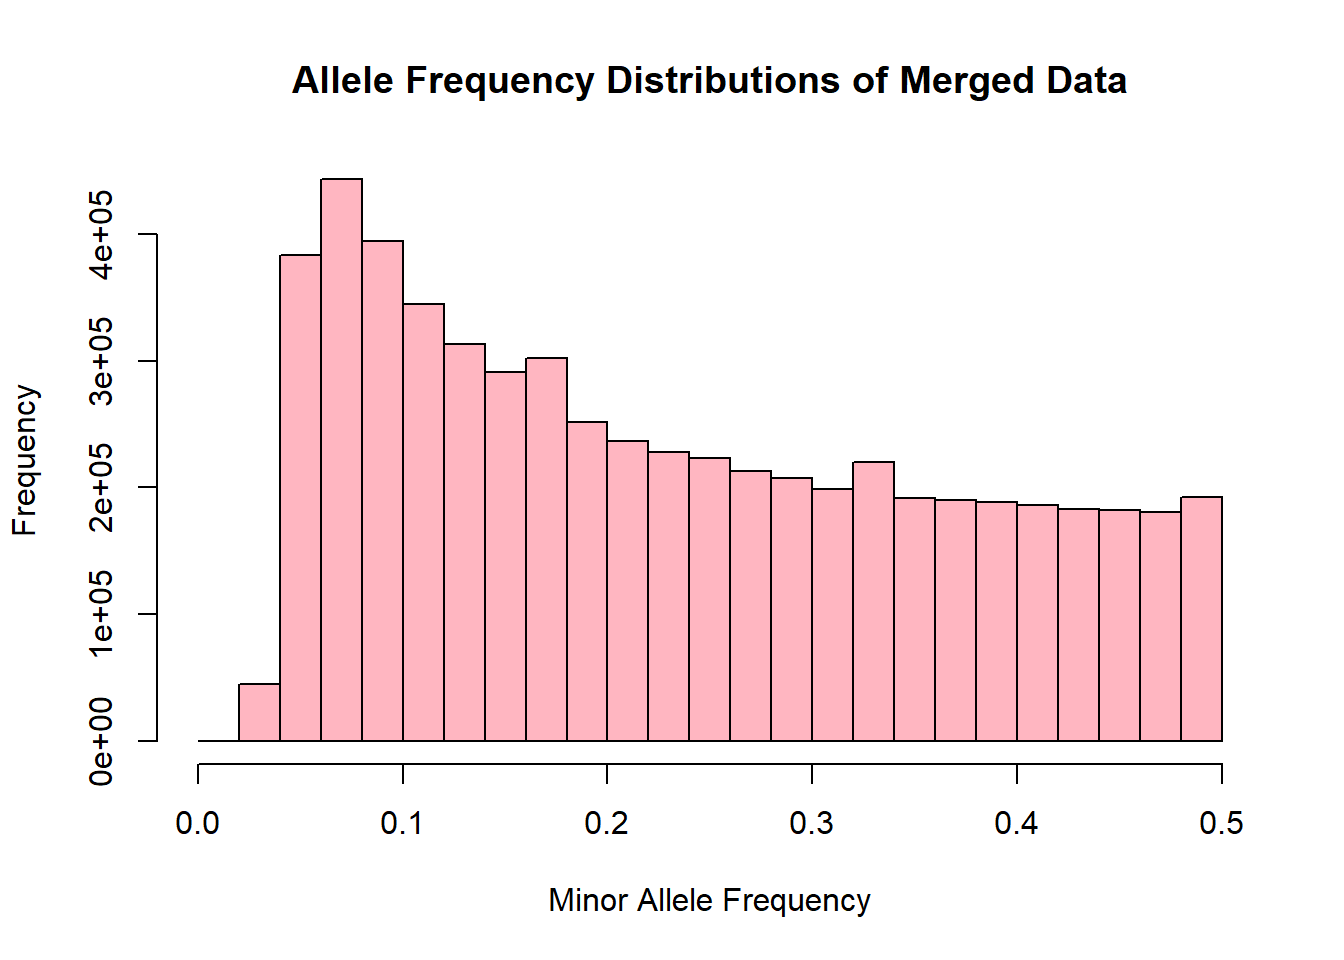
8.Load allele frequency file for merged data set
merged_allele_freq <- read.table('C:/Users/Martha/Documents/Honours/Project/honours.project/Data/plink_output/merged_allele_freq.frq', header = T)9.Generate histogram for allele freq distributions
hist(merged_allele_freq$MAF, main = "Allele Frequency Distributions of Merged Data", xlab = "Minor Allele Frequency", xlim = c(0.0, 0.5), col = "lightpink")